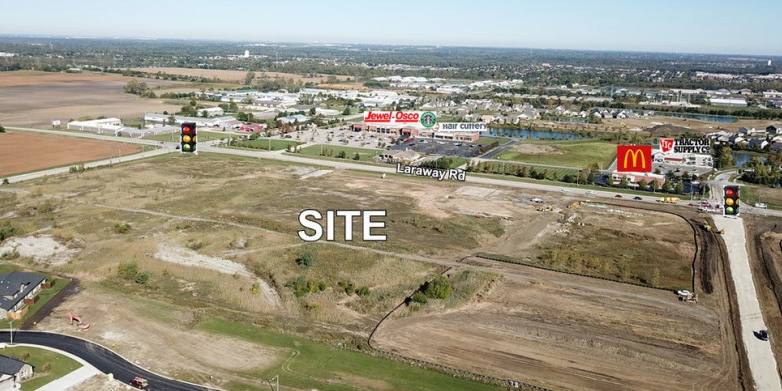
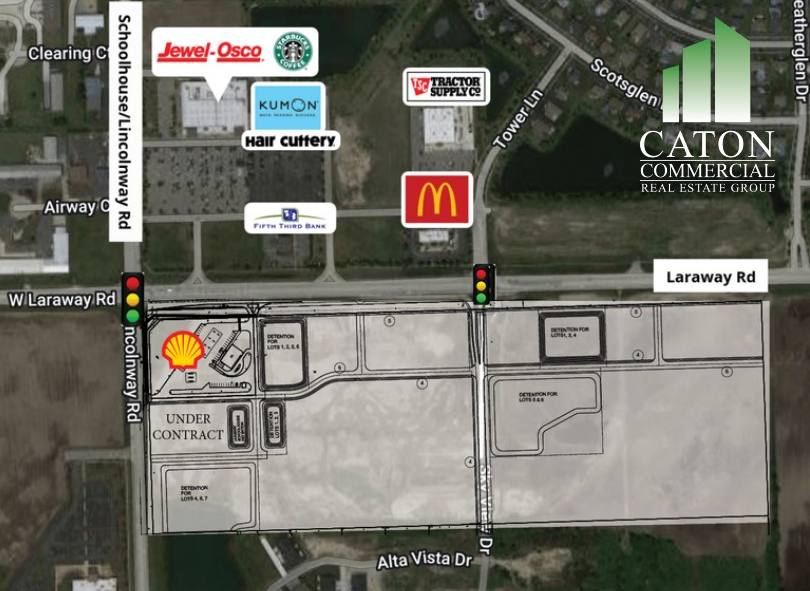
Commercial Land
SEC Laraway and Schoolhouse New Lenox, IL 60451
SEC Laraway and Schoolhouse New Lenox, IL 60451
Details & Description
Property Highlights
- • Divisible down to 1 acre
- • Electric, gas, water and sewer to site
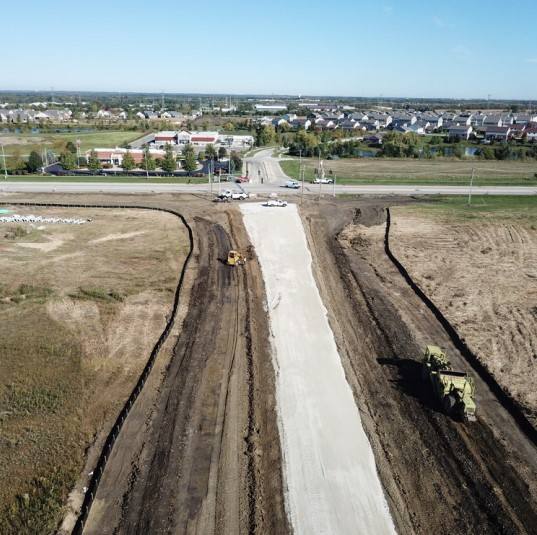
- • Sky View Dr extension complete
Listing Agents

Brian Blackmore
O: 815-436-5700
M: 630-207-8292
brian@catoncommercial.com
O: 815-436-5700
M: 630-207-8292
brian@catoncommercial.com
While we strive to provide the most accurate information, all listing information, and demographic data, is provided by third-parties. As such, MyEListing will not be responsible for the accuracy of the information. It is strongly recommended that you verify all information with the listing agent, and any relevant agencies, prior to making any decisions.