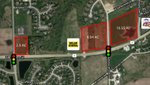
1-Mile | 3-Miles | 5-Miles | ||
---|---|---|---|---|
Total Population | 3,895 | 19,482 | 26,173 | |
Population Median Age | 36 | 36 | 36 | |
Population by Age | 0-9 Yrs | 519 (13%) | 2669 (13%) | 3669 (14%) |
10-19 Yrs | 653 (16%) | 3295 (16%) | 4311 (16%) | |
20-29 Yrs | 535 (13%) | 2521 (12%) | 3189 (12%) | |
30-39 Yrs | 434 (11%) | 2402 (12%) | 3201 (12%) | |
40-49 Yrs | 653 (16%) | 2916 (14%) | 3872 (14%) | |
50-59 Yrs | 448 (11%) | 2455 (12%) | 3451 (13%) | |
60-69 Yrs | 425 (10%) | 1928 (9%) | 2630 (10%) | |
70+ Yrs | 229 (5%) | 1295 (6%) | 1850 (7%) | |
Median HH Income | $107,623 | $97,085 | $96,139 | |
Total Household Income | < 24K | 41 (3%) | 415 (6%) | 525 (6%) |
25-49K | 76 (6%) | 768 (11%) | 1080 (12%) | |
50-74K | 161 (13%) | 898 (13%) | 1309 (15%) | |
75-99K | 279 (22%) | 1303 (20%) | 1713 (19%) | |
100-199K | 493 (40%) | 2401 (37%) | 3228 (36%) | |
200K+ | 170 (13%) | 679 (10%) | 870 (9%) | |
Highest Education Level | No Diploma | 107 | 531 | 743 |
Diploma or GED | 454 | 2768 | 4189 | |
Some College | 674 | 3635 | 4762 | |
Assoc. Degree | 292 | 1317 | 1726 | |
Bachelors Degree | 532 | 2443 | 3208 | |
Higher Degree | 348 | 1544 | 2033 | |
Total Housing Units | 1,234 | 6,526 | 8,877 | |
--Owner-Occupied | 1,089 | 5,668 | 7,676 | |
--Renter-Occupied | 131 | 796 | 1,049 | |
Owner-Occupied Values | < 100K | 3 | 190 | 406 |
100-199K | 187 | 1757 | 2195 | |
200-299K | 529 | 2512 | 3279 | |
300-399K | 231 | 844 | 1248 | |
400-499K | 97 | 269 | 389 | |
500K+ | 42 | 96 | 159 | |
Total Working Age Population | 3,005 | 14,777 | 19,791 | |
In Work Force | 2,167 | 10,747 | 14,043 | |
Not In Work Force | 838 | 4,031 | 5,748 | |
Workforce Employed | 2,045 | 10,306 | 13,468 | |
Workforce Unemployed | 121 | 440 | 572 | |
Civlian Workforce | 2,167 | 10,746 | 14,039 | |
Military Workforce | 0 | 1 | 3 | |
Total Households | 1,220 | 6,464 | 8,725 | |
Family Households | 1,060 | 5,207 | 7,096 | |
Non-Family Households | 160 | 1,257 | 1,629 | |
Married Couple | 952 | 4,442 | 5,984 | |
Other Family | 108 | 765 | 1,112 | |
Married w/Child | 491 | 2,230 | 2,943 | |
Single Male w/Child | 17 | 113 | 183 | |
Single Female w/Child | 44 | 404 | 548 |
Population Change Last Two Decades - Plus Projection
2000 | % | 2010 | % | 2020 | % | 2030 | |
---|---|---|---|---|---|---|---|
Illinois | 12,419,293 | +3 | 12,830,632 | +12 | 14,316,487 | +6 | 15,138,849 |
Kendall County | 54,544 | +110 | 114,736 | -31 | 78,694 | +8 | 85,060 |
Grundy County | 37,535 | +33 | 50,063 | -7 | 46,454 | +9 | 50,414 |
Will County | 502,266 | +35 | 677,560 | +34 | 907,625 | +20 | 1,093,207 |
Total Working Age Population:
Total Households:
Total Working Age Population:
Total Households:
Total Working Age Population:
Total Households: