Industrial Properties
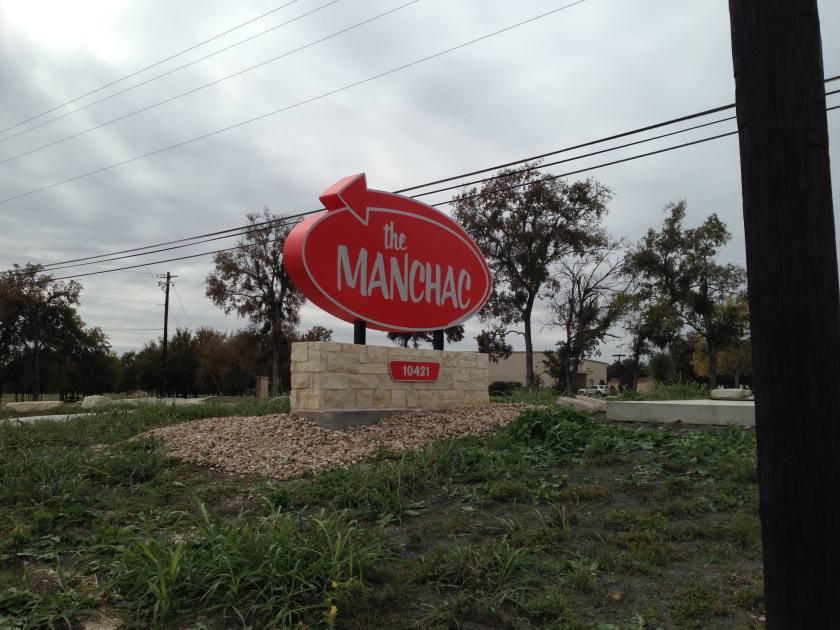
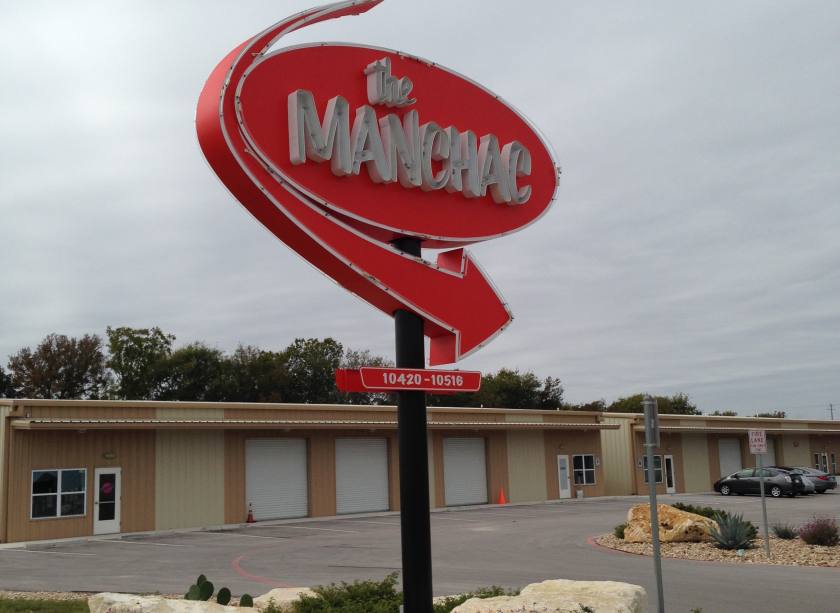
10420 - 10516 Menchaca Rd Austin, TX 78748
10420 - 10516 Menchaca Rd Austin, TX 78748
Details & Description
Property Highlights
• 100% Leased
• Phase 1 of 2
Listing Agents

Susan Harris
O: 512-480-9343
susan@austinsitesolutions.com
O: 512-480-9343
susan@austinsitesolutions.com
While we strive to provide the most accurate information, all listing information, and demographic data, is provided by third-parties. As such, MyEListing will not be responsible for the accuracy of the information. It is strongly recommended that you verify all information with the listing agent, and any relevant agencies, prior to making any decisions.