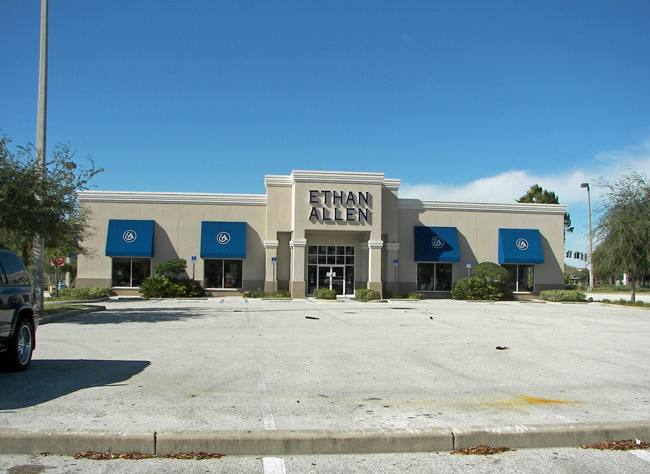
1-Mile | 3-Miles | 5-Miles | ||
---|---|---|---|---|
Total Population | 6,766 | 81,845 | 205,175 | |
Population Median Age | 40 | 40 | 39 | |
Population by Age | 0-9 Yrs | 700 (10%) | 9760 (11%) | 24051 (11%) |
10-19 Yrs | 788 (11%) | 9733 (11%) | 24620 (11%) | |
20-29 Yrs | 937 (13%) | 9299 (11%) | 24629 (12%) | |
30-39 Yrs | 1239 (18%) | 11090 (13%) | 29717 (14%) | |
40-49 Yrs | 796 (11%) | 12682 (15%) | 30942 (15%) | |
50-59 Yrs | 766 (11%) | 10777 (13%) | 28642 (13%) | |
60-69 Yrs | 733 (10%) | 10464 (12%) | 23029 (11%) | |
70+ Yrs | 807 (11%) | 8039 (9%) | 19545 (9%) | |
Median HH Income | $61,369 | $66,422 | $68,140 | |
Total Household Income | < 24K | 482 (16%) | 4695 (15%) | 10549 (13%) |
25-49K | 468 (16%) | 5970 (19%) | 15737 (20%) | |
50-74K | 825 (28%) | 6327 (20%) | 15406 (20%) | |
75-99K | 375 (13%) | 4088 (13%) | 10078 (13%) | |
100-199K | 558 (19%) | 6714 (21%) | 17708 (23%) | |
200K+ | 151 (5%) | 2899 (9%) | 6766 (8%) | |
Highest Education Level | No Diploma | 381 | 4376 | 12563 |
Diploma or GED | 1067 | 15460 | 37092 | |
Some College | 1072 | 10043 | 25006 | |
Assoc. Degree | 648 | 5213 | 13992 | |
Bachelors Degree | 1187 | 15150 | 37429 | |
Higher Degree | 544 | 8123 | 20347 | |
Total Housing Units | 3,083 | 33,072 | 81,969 | |
--Owner-Occupied | 1,732 | 21,167 | 49,243 | |
--Renter-Occupied | 1,127 | 9,525 | 27,000 | |
Owner-Occupied Values | < 100K | 149 | 2690 | 5106 |
100-199K | 390 | 4255 | 10366 | |
200-299K | 671 | 6638 | 15449 | |
300-399K | 339 | 3887 | 9029 | |
400-499K | 123 | 1774 | 4500 | |
500K+ | 59 | 1923 | 4794 | |
Total Working Age Population | 5,568 | 66,304 | 166,456 | |
In Work Force | 3,674 | 43,091 | 112,951 | |
Not In Work Force | 1,893 | 23,213 | 53,505 | |
Workforce Employed | 3,551 | 41,304 | 107,557 | |
Workforce Unemployed | 116 | 1,708 | 5,125 | |
Civlian Workforce | 3,667 | 43,013 | 112,683 | |
Military Workforce | 7 | 78 | 268 | |
Total Households | 2,858 | 30,692 | 76,244 | |
Family Households | 1,588 | 20,505 | 51,302 | |
Non-Family Households | 1,270 | 10,187 | 24,942 | |
Married Couple | 1,038 | 14,863 | 37,359 | |
Other Family | 550 | 5,642 | 13,943 | |
Married w/Child | 464 | 5,845 | 14,806 | |
Single Male w/Child | 73 | 917 | 2,184 | |
Single Female w/Child | 198 | 2,219 | 5,353 |
Population Change Last Two Decades - Plus Projection
2000 | % | 2010 | % | 2020 | % | 2030 | |
---|---|---|---|---|---|---|---|
Florida | 15,982,378 | +18 | 18,801,310 | +14 | 21,517,610 | +13 | 24,340,457 |
Hillsborough County | 998,948 | +23 | 1,229,226 | +19 | 1,466,803 | +16 | 1,708,550 |
Pinellas County | 921,482 | -1 | 916,542 | +7 | 983,883 | +5 | 1,034,290 |
Total Working Age Population:
Total Households:
Total Working Age Population:
Total Households:
Total Working Age Population:
Total Households: