Commercial Land
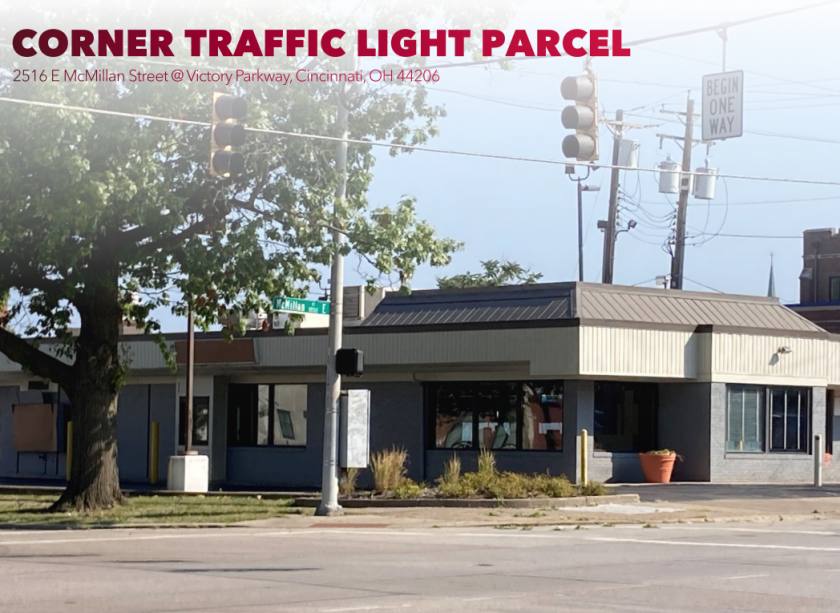
2516 East McMillan Street Cincinnati, OH 45206
2516 East McMillan Street Cincinnati, OH 45206
Details & Description
Property Highlights
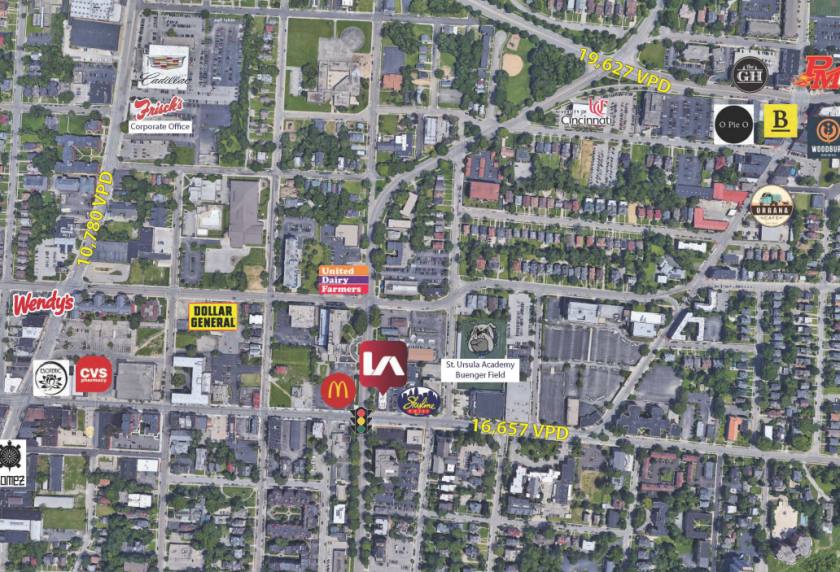
• Very dense urban population with lots of local traffic generators from St. Ursula High School, Eden Park, Mt. Adams
• Perfect for restaurant or retail including coffee, bakery, fast-casual, dry cleaners, hair salons and banks
Additional Photos

Listing Agents

John Thompson
O: 513-588-1842
M: 513-703-2500
jthompson@lee-associates.com
O: 513-588-1842
M: 513-703-2500
jthompson@lee-associates.com
While we strive to provide the most accurate information, all listing information, and demographic data, is provided by third-parties. As such, MyEListing will not be responsible for the accuracy of the information. It is strongly recommended that you verify all information with the listing agent, and any relevant agencies, prior to making any decisions.


