Retail Space
11755 Mosteller Road Sharonville, OH 45241
11755 Mosteller Road Sharonville, OH 45241

Details & Description
Property Highlights
- • Retail/office/industrial space
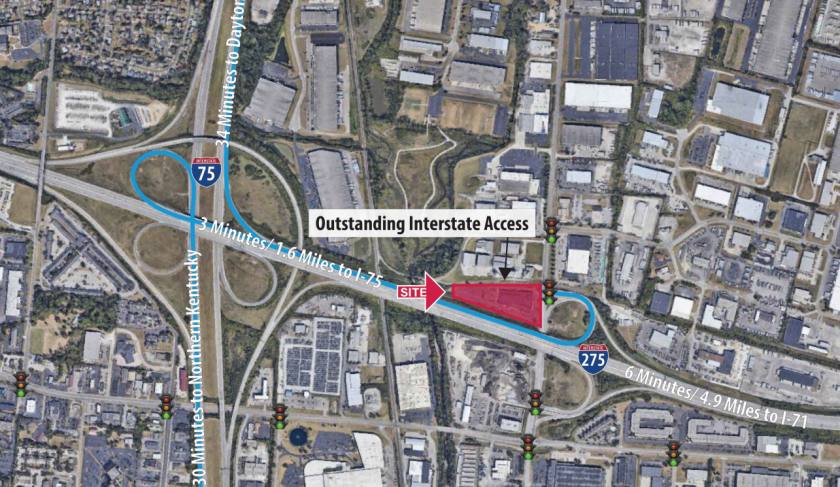
- • Great visibility from I- 275 & Mosteller Road
- • Excellent signage opportunity facing I- 275
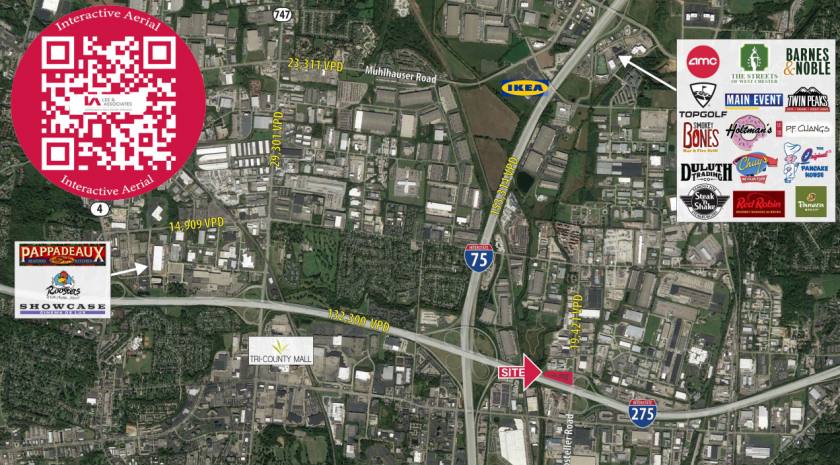
- • Numerous nearby amenities
- • Operating expenses: $3.43/SF
- • Micro Center generates significant cross traffic
Additional Photos

Listing Agents

John Thompson
O: 513-588-1842
M: 513-703-2500
jthompson@lee-associates.com
O: 513-588-1842
M: 513-703-2500
jthompson@lee-associates.com

Molly Hoffman
O: 513-588-1843
mhoffman@lee-associates.com
O: 513-588-1843
mhoffman@lee-associates.com

TC Bartoszek
O: 513-588-1840
M: 513-535-0563
tcbartoszek@lee-associates.com
O: 513-588-1840
M: 513-535-0563
tcbartoszek@lee-associates.com
While we strive to provide the most accurate information, all listing information, and demographic data, is provided by third-parties. As such, MyEListing will not be responsible for the accuracy of the information. It is strongly recommended that you verify all information with the listing agent, and any relevant agencies, prior to making any decisions.


