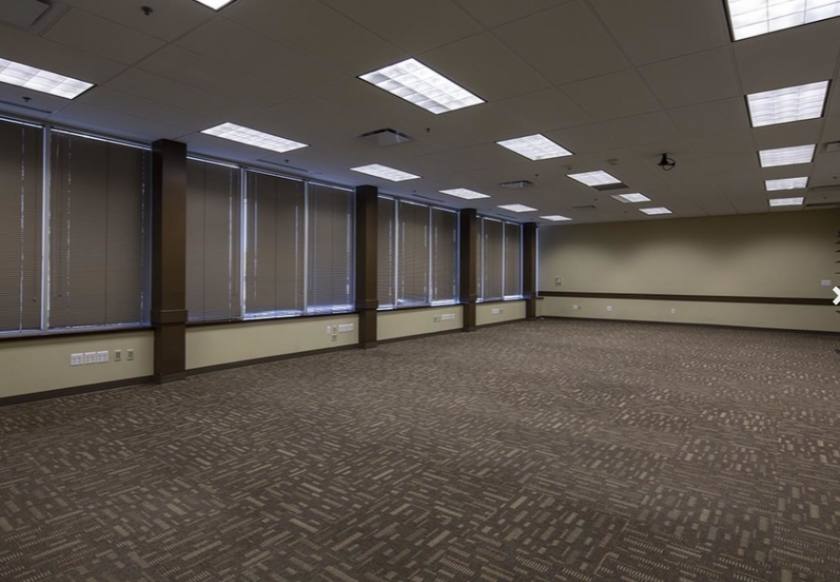
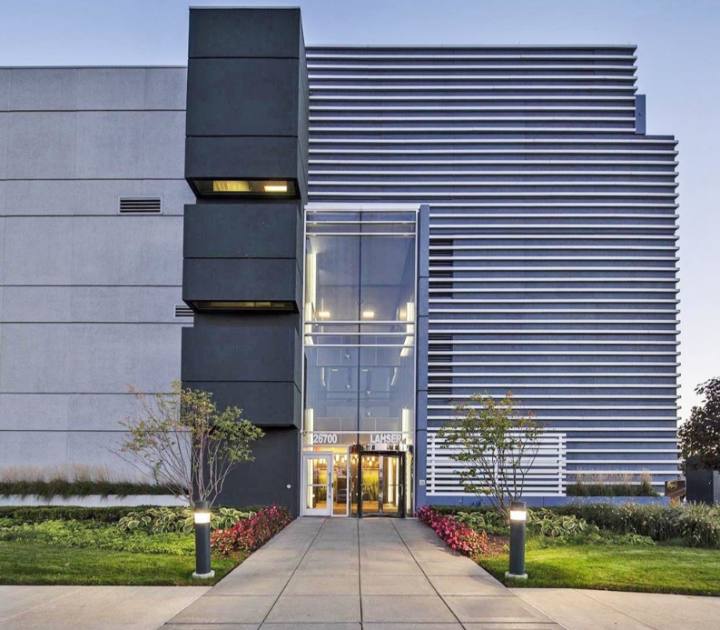
Office Space
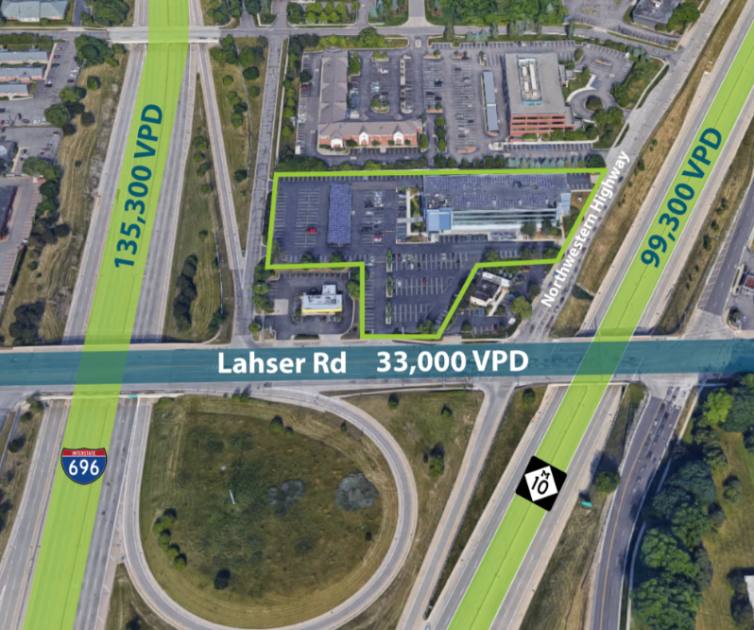
26700 Lahser Road Southfield, MI 48076
26700 Lahser Road Southfield, MI 48076
Details & Description
Property Highlights
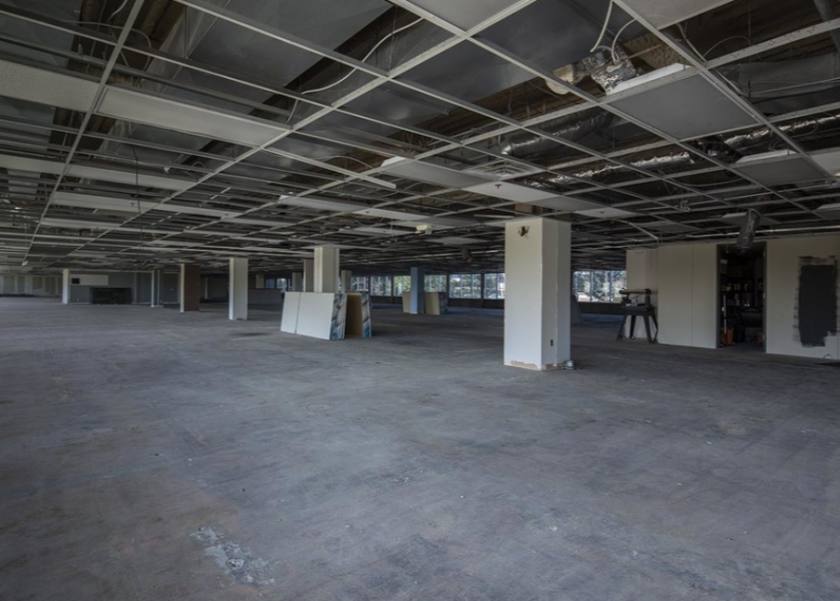
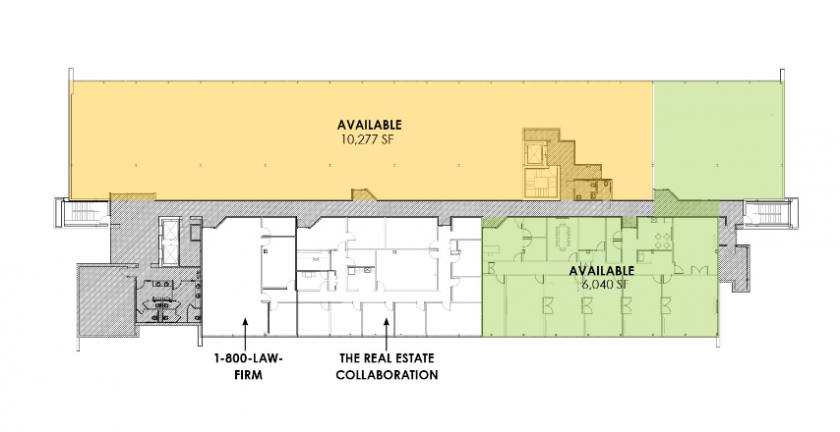
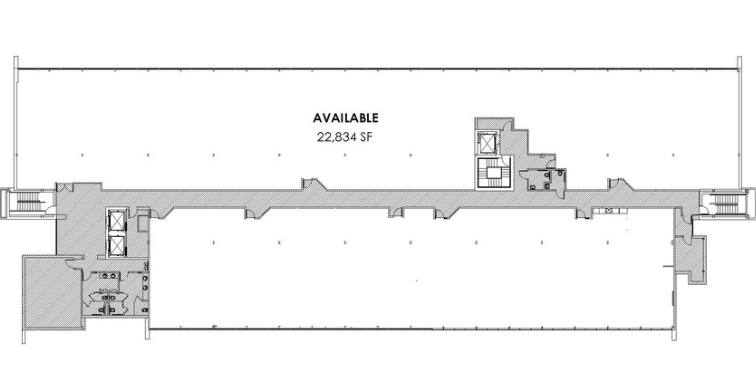
- • 5,000 - 62,000 SF available
- • Excellent visibility - 350,000 VPD
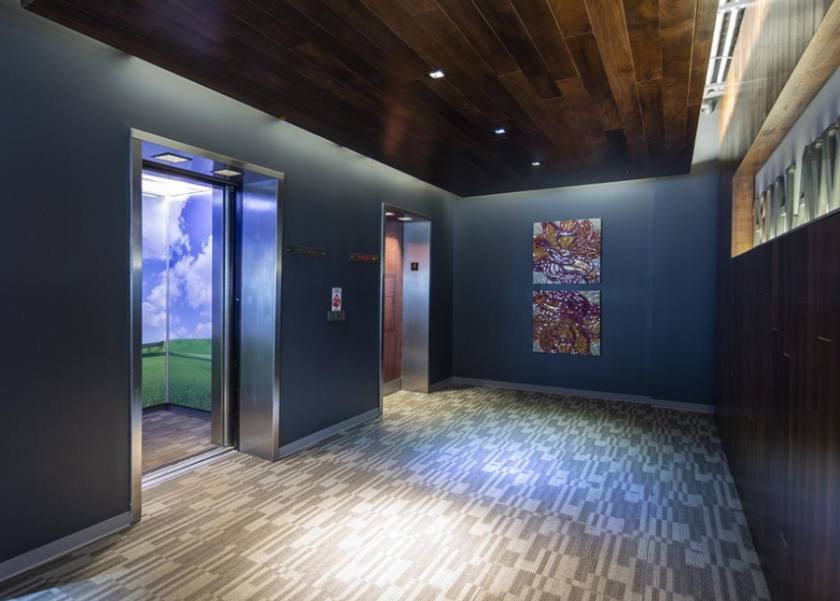
- • Full height and glass/loft space available
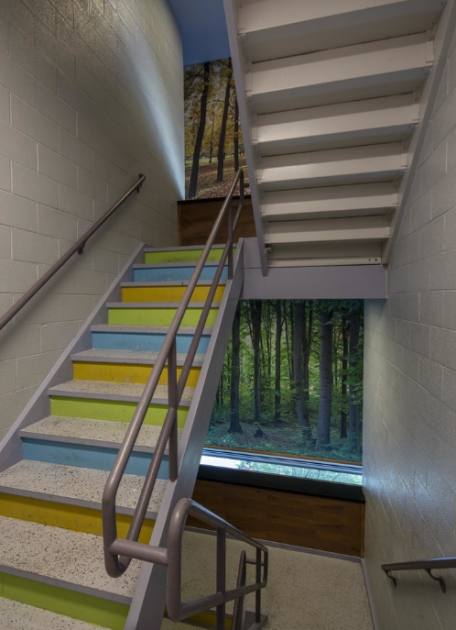
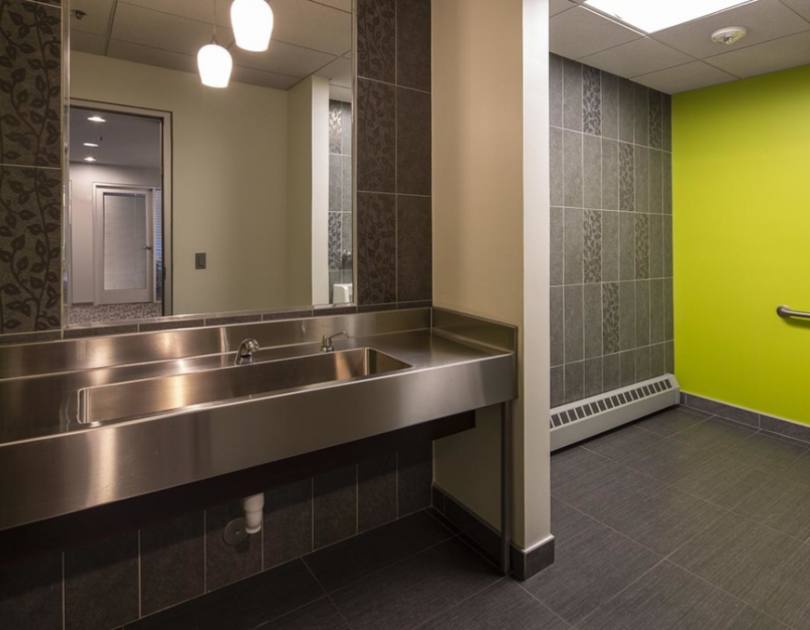
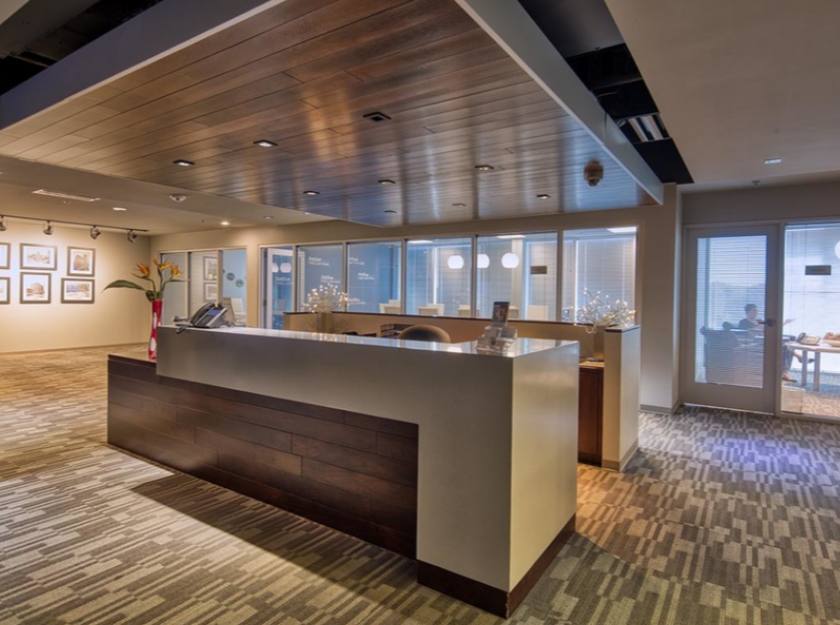
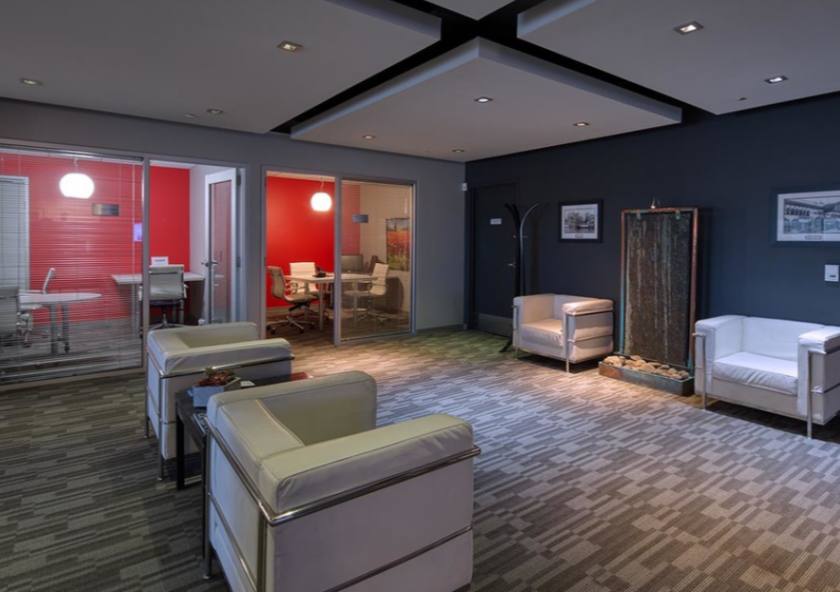
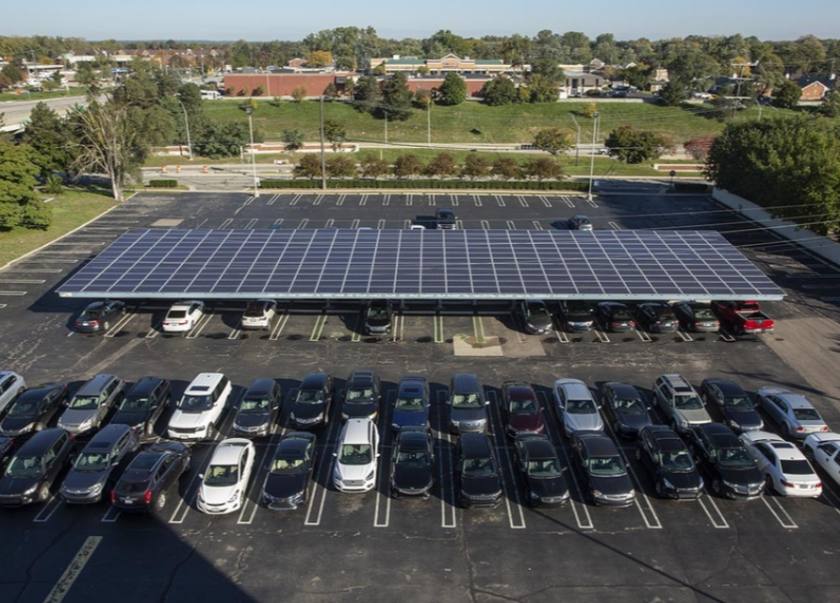
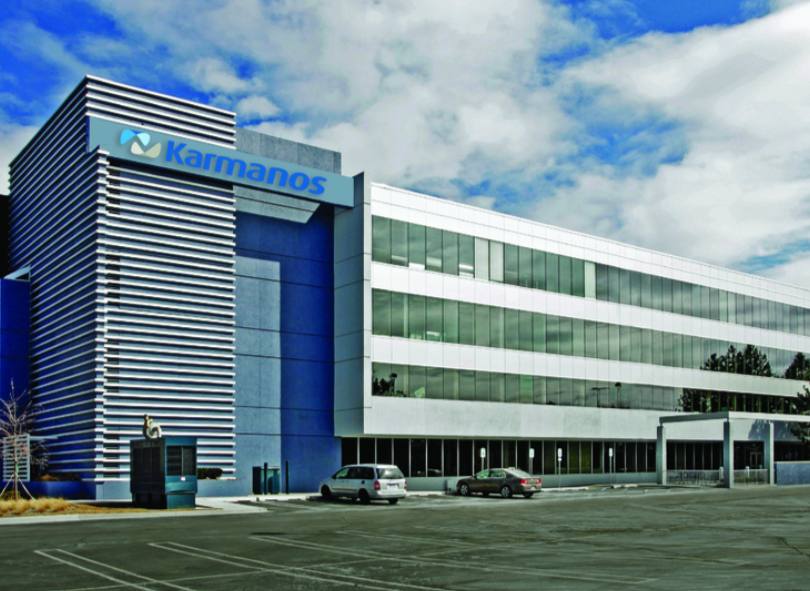
- • Professionally managed and maintained
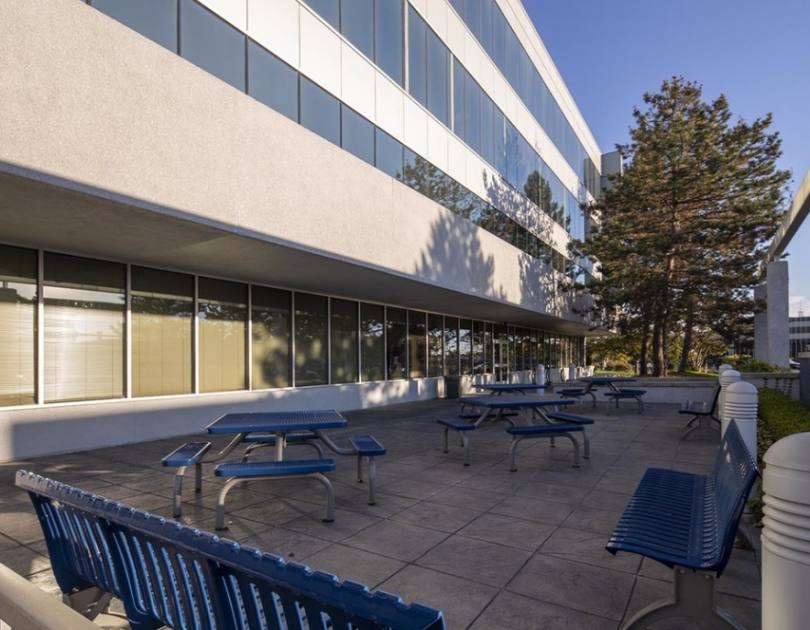
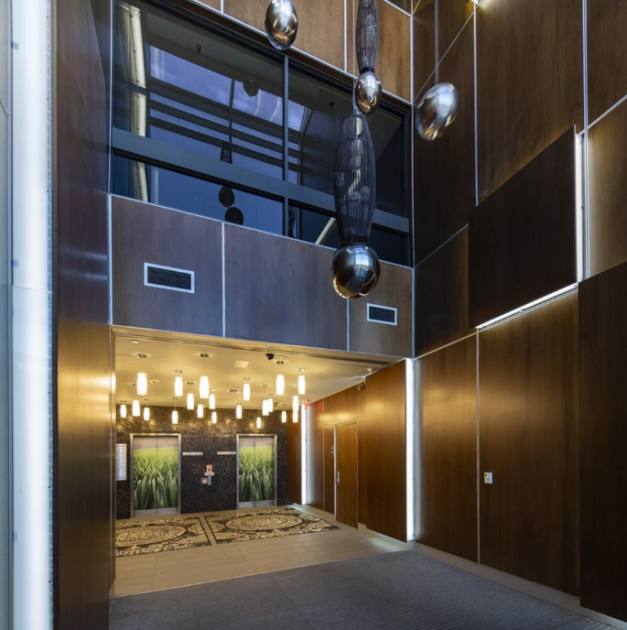
Additional Photos

Listing Agents

Matthew Schiffman
O: 248-281-9907
M: 248-943-6449
matt@pacommercial.com
O: 248-281-9907
M: 248-943-6449
matt@pacommercial.com

Mike Gunn
O: 248-331-0202
M: 248-924-7499
mike@pacommercial.com
O: 248-331-0202
M: 248-924-7499
mike@pacommercial.com

Brianna Johnston
O: 248-663-0507
M: 419-605-8579
brianna@pacommercial.com
O: 248-663-0507
M: 419-605-8579
brianna@pacommercial.com
While we strive to provide the most accurate information, all listing information, and demographic data, is provided by third-parties. As such, MyEListing will not be responsible for the accuracy of the information. It is strongly recommended that you verify all information with the listing agent, and any relevant agencies, prior to making any decisions.