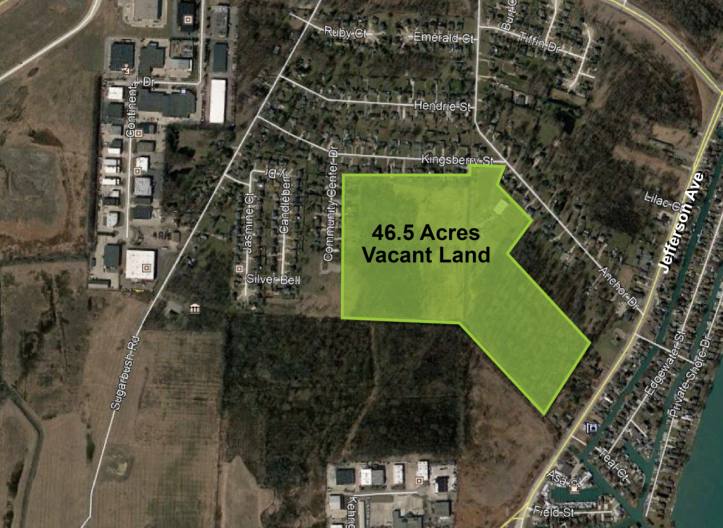
Commercial Land
Kingsberry Street Macomb, MI 48042
Kingsberry Street Macomb, MI 48042
Details & Description
Property Highlights
- • Convenient location right off of I-94
- • Walking distance to Lake St. Clair
- • R1B - One-family residential zoning
- • L'Anse Creuse Schools
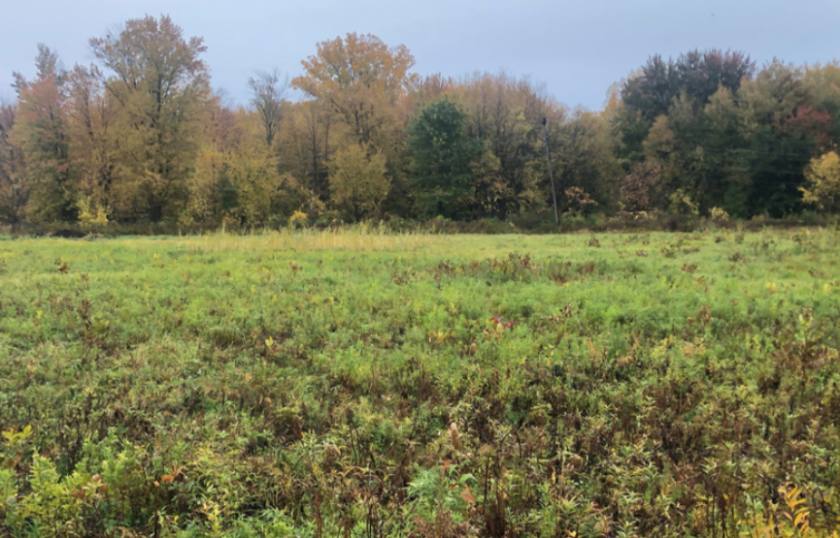
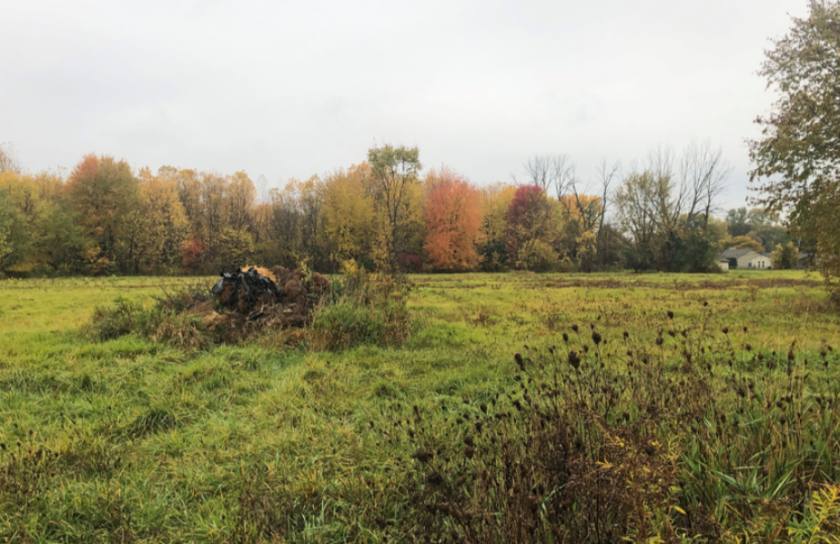
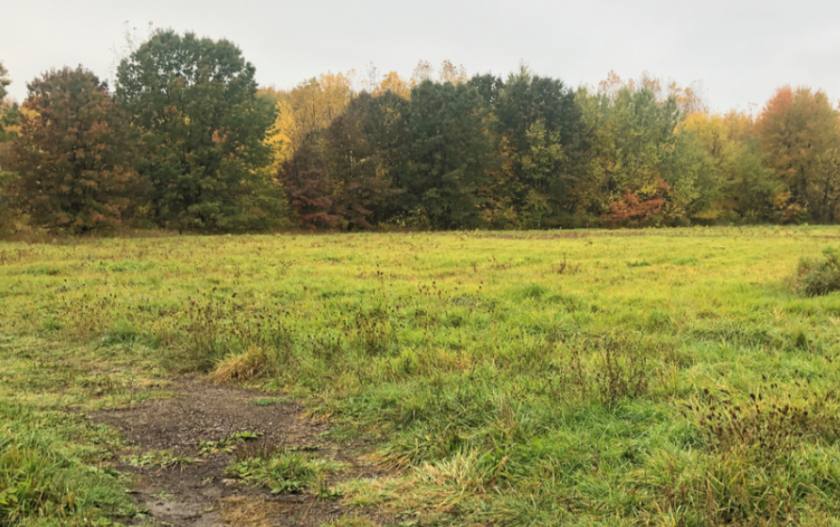
Additional Photos

Listing Agents

Kevin Bull
O: 248-358-5361
M: 248-895-9972
kevin@pacommercial.com
O: 248-358-5361
M: 248-895-9972
kevin@pacommercial.com

John Arthurs
O: 248-663-0506
M: 248-563-3225
johna@pacommercial.com
O: 248-663-0506
M: 248-563-3225
johna@pacommercial.com
While we strive to provide the most accurate information, all listing information, and demographic data, is provided by third-parties. As such, MyEListing will not be responsible for the accuracy of the information. It is strongly recommended that you verify all information with the listing agent, and any relevant agencies, prior to making any decisions.


