Commercial Land
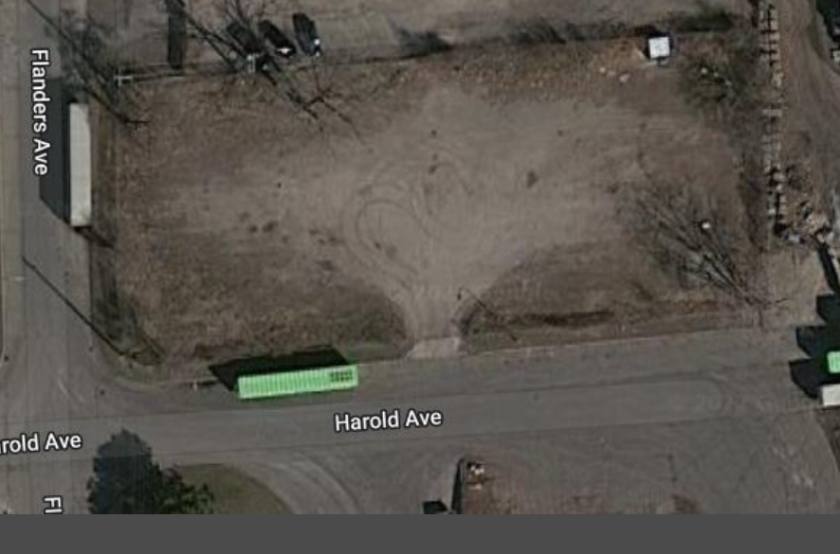
25700 Flanders Avenue Warren, MI 48089
25700 Flanders Avenue Warren, MI 48089
Details & Description
Property Highlights
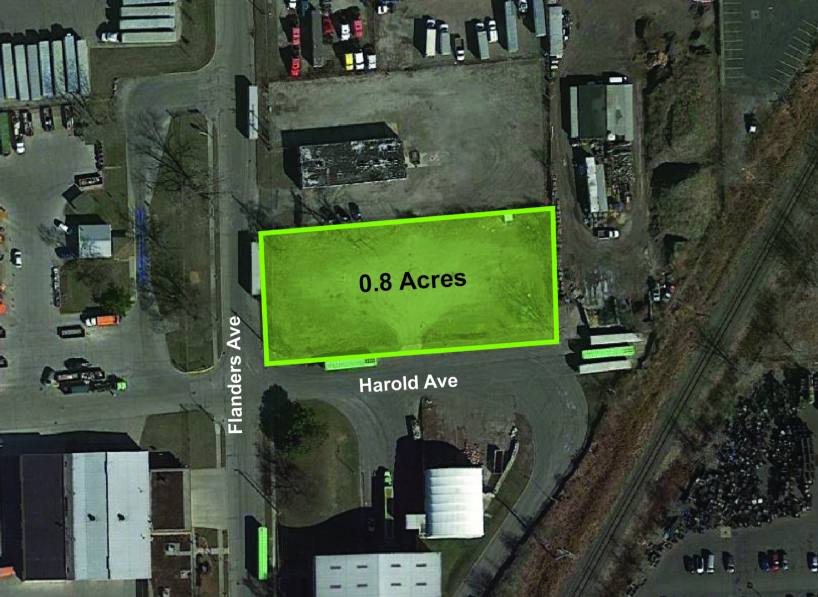
- • Great development opportunity
- • Located minutes from I-696 & Groesbeck Hwy
- • Heavy Industrial Zoning
- • Cleared lot 100' x 380' approximately
Listing Agents

Kevin Bull
O: 248-358-5361
M: 248-895-9972
kevin@pacommercial.com
O: 248-358-5361
M: 248-895-9972
kevin@pacommercial.com
While we strive to provide the most accurate information, all listing information, and demographic data, is provided by third-parties. As such, MyEListing will not be responsible for the accuracy of the information. It is strongly recommended that you verify all information with the listing agent, and any relevant agencies, prior to making any decisions.