Specialty Real Estate
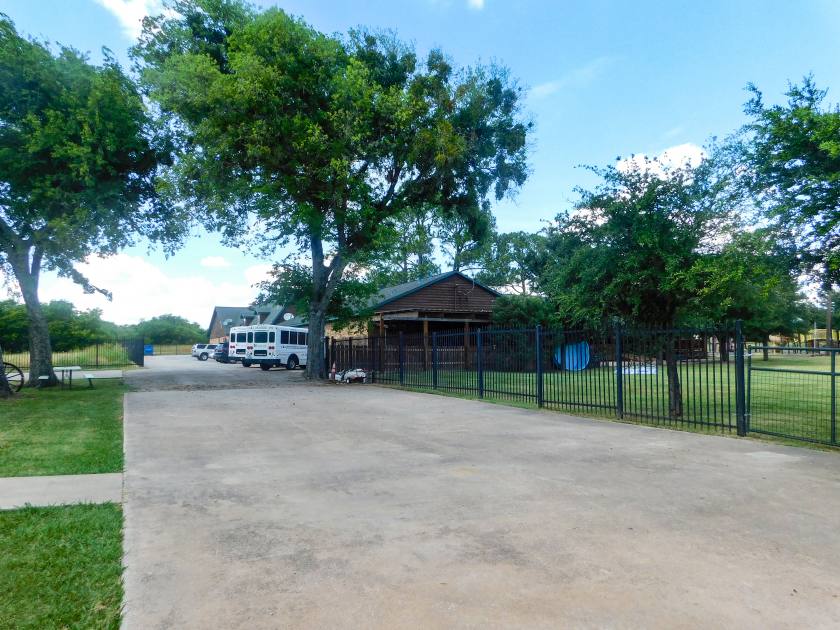
3131 North Belt Line Road Mesquite, TX 75182
3131 North Belt Line Road Mesquite, TX 75182
Details & Description
Property Highlights
- • Original owner
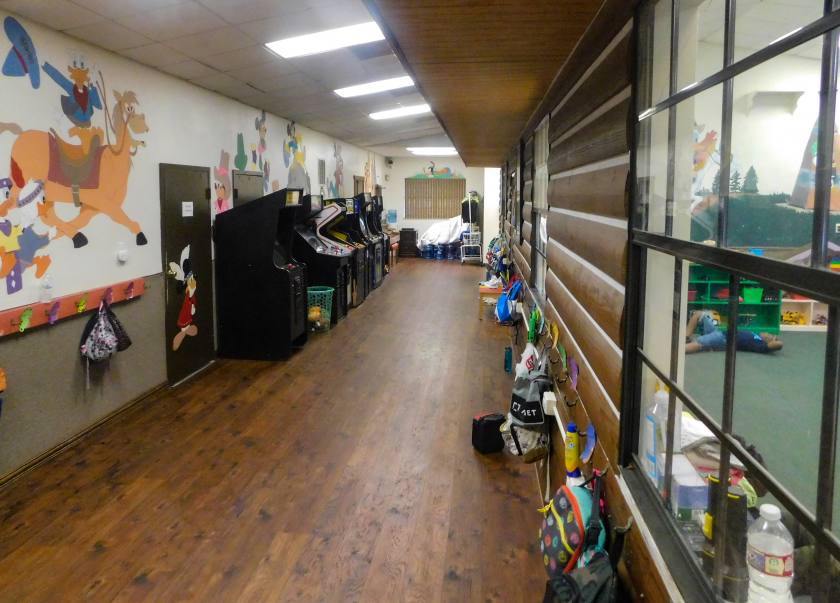
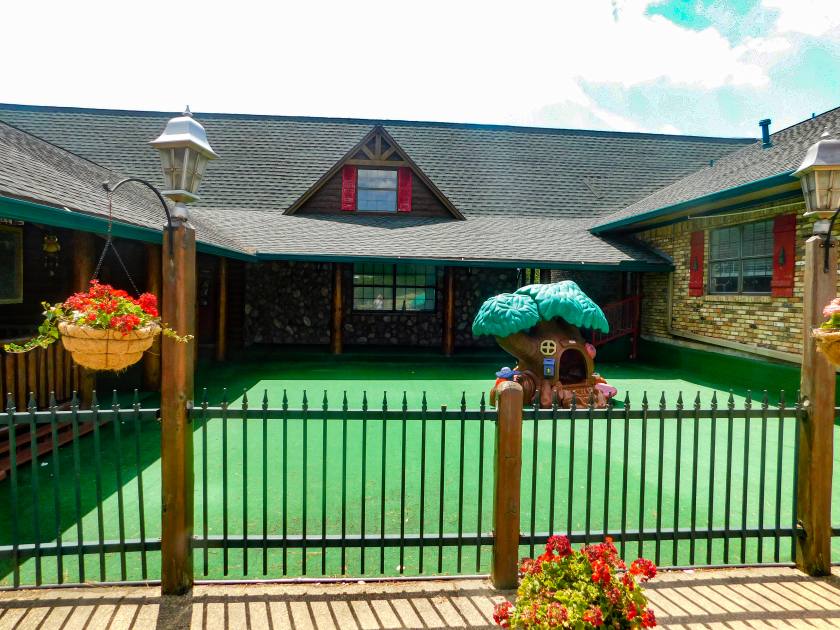
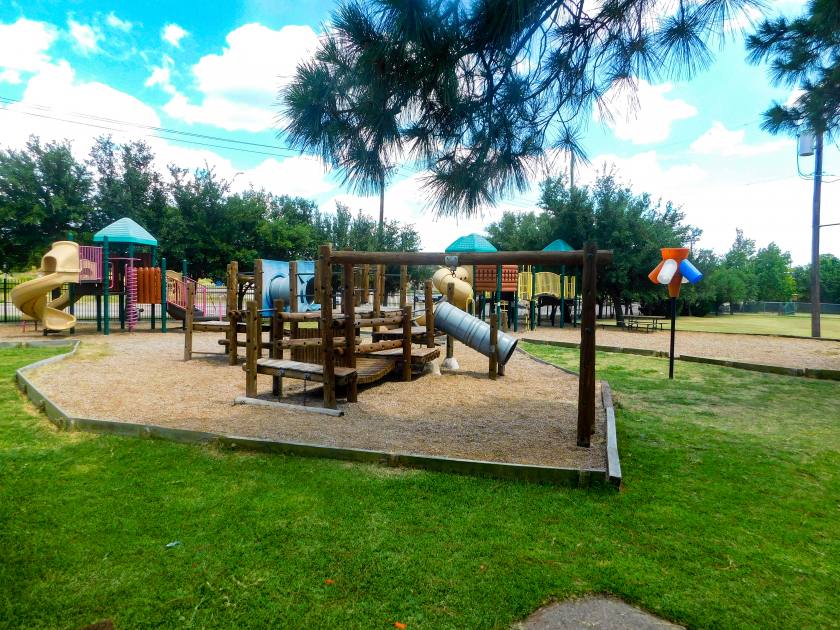
- • Very large playground
- • 244-student license capacity
- • Will consider long term lease at market rate
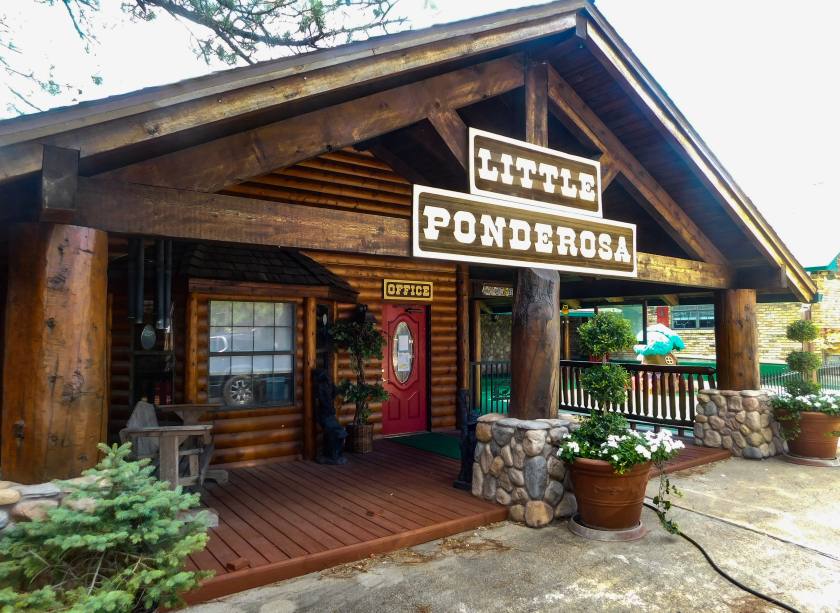
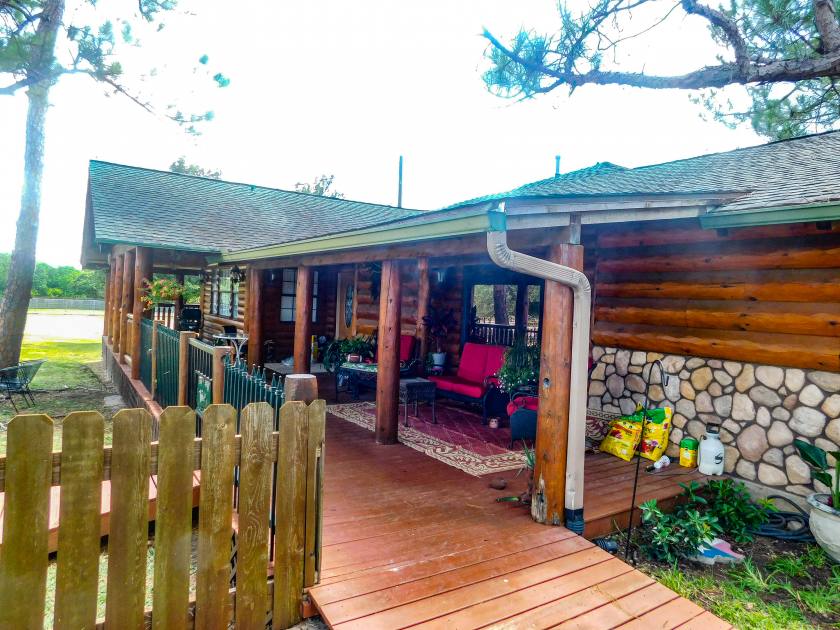
Additional Photos

Listing Agents

Brian Hanie
O: 214-466-1541
brian@structurecommercial.com
O: 214-466-1541
brian@structurecommercial.com

John Hiller
O: 214-466-1546
M: 214-668-7365
john@structurecommercial.com
O: 214-466-1546
M: 214-668-7365
john@structurecommercial.com
While we strive to provide the most accurate information, all listing information, and demographic data, is provided by third-parties. As such, MyEListing will not be responsible for the accuracy of the information. It is strongly recommended that you verify all information with the listing agent, and any relevant agencies, prior to making any decisions.