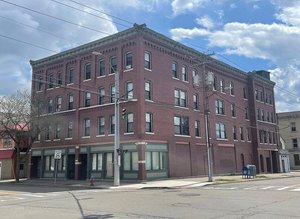
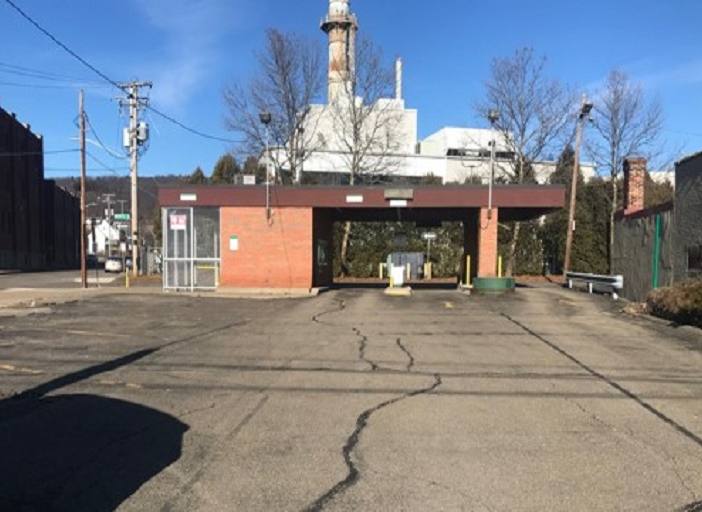
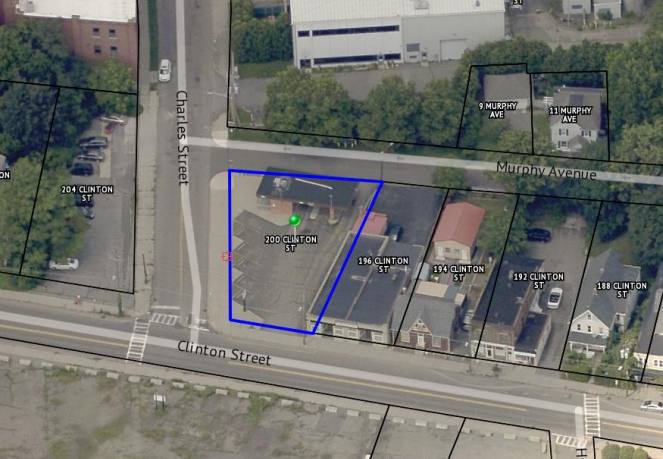
1-Mile | 3-Miles | 5-Miles | ||
---|---|---|---|---|
Total Population | 17,903 | 72,323 | 97,892 | |
Population Median Age | 38 | 38 | 39 | |
Population by Age | 0-9 Yrs | 1427 (7%) | 6964 (9%) | 9664 (9%) |
10-19 Yrs | 1711 (9%) | 9838 (13%) | 13650 (13%) | |
20-29 Yrs | 5926 (33%) | 16833 (23%) | 20575 (21%) | |
30-39 Yrs | 1764 (9%) | 7478 (10%) | 9931 (10%) | |
40-49 Yrs | 1351 (7%) | 6553 (9%) | 9060 (9%) | |
50-59 Yrs | 1720 (9%) | 8427 (11%) | 11612 (11%) | |
60-69 Yrs | 1925 (10%) | 7993 (11%) | 11335 (11%) | |
70+ Yrs | 2079 (11%) | 8237 (11%) | 12066 (12%) | |
Median HH Income | $32,780 | $39,750 | $46,260 | |
Total Household Income | < 24K | 3272 (42%) | 10498 (34%) | 12257 (30%) |
25-49K | 1535 (19%) | 6990 (23%) | 8917 (22%) | |
50-74K | 993 (12%) | 4862 (16%) | 6634 (16%) | |
75-99K | 877 (11%) | 3032 (10%) | 4366 (10%) | |
100-199K | 806 (10%) | 3641 (12%) | 5987 (15%) | |
200K+ | 245 (3%) | 973 (3%) | 1532 (3%) | |
Highest Education Level | No Diploma | 1465 | 5729 | 6843 |
Diploma or GED | 3157 | 13134 | 17676 | |
Some College | 2039 | 7889 | 10080 | |
Assoc. Degree | 876 | 4873 | 7033 | |
Bachelors Degree | 1479 | 6843 | 10255 | |
Higher Degree | 1670 | 5858 | 9177 | |
Total Housing Units | 9,303 | 34,872 | 45,376 | |
--Owner-Occupied | 2,841 | 14,268 | 21,367 | |
--Renter-Occupied | 4,887 | 15,729 | 18,326 | |
Owner-Occupied Values | < 100K | 1460 | 7156 | 9284 |
100-199K | 1103 | 5337 | 8339 | |
200-299K | 165 | 1045 | 2236 | |
300-399K | 7 | 248 | 625 | |
400-499K | 86 | 218 | 318 | |
500K+ | 20 | 264 | 564 | |
Total Working Age Population | 15,544 | 61,571 | 82,881 | |
In Work Force | 8,995 | 33,767 | 45,165 | |
Not In Work Force | 6,550 | 27,804 | 37,715 | |
Workforce Employed | 7,828 | 29,972 | 40,822 | |
Workforce Unemployed | 1,162 | 3,782 | 4,329 | |
Civlian Workforce | 8,991 | 33,753 | 45,151 | |
Military Workforce | 4 | 14 | 14 | |
Total Households | 7,728 | 29,997 | 39,692 | |
Family Households | 3,030 | 14,397 | 20,485 | |
Non-Family Households | 4,698 | 15,601 | 19,208 | |
Married Couple | 1,839 | 9,010 | 13,822 | |
Other Family | 1,191 | 5,386 | 6,663 | |
Married w/Child | 550 | 2,907 | 4,457 | |
Single Male w/Child | 93 | 503 | 673 | |
Single Female w/Child | 627 | 2,666 | 3,059 |
Population Change Last Two Decades - Plus Projection
2000 | % | 2010 | % | 2020 | % | 2030 | |
---|---|---|---|---|---|---|---|
New York | 18,976,457 | +2 | 19,378,102 | +4 | 20,146,131 | +2 | 20,604,030 |
Broome County | 200,536 | 0 | 200,600 | -4 | 192,262 | -3 | 186,950 |
Total Working Age Population:
Total Households:
Total Working Age Population:
Total Households:
Total Working Age Population:
Total Households: