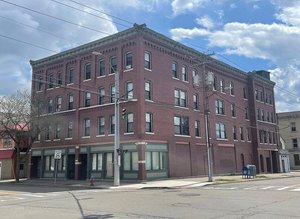
1-Mile | 3-Miles | 5-Miles | ||
---|---|---|---|---|
Total Population | 16,393 | 62,761 | 112,866 | |
Population Median Age | 38 | 38 | 39 | |
Population by Age | 0-9 Yrs | 2091 (12%) | 5573 (8%) | 11193 (9%) |
10-19 Yrs | 1694 (10%) | 9004 (14%) | 15252 (13%) | |
20-29 Yrs | 3419 (20%) | 15745 (25%) | 22967 (20%) | |
30-39 Yrs | 2124 (12%) | 6280 (10%) | 11847 (10%) | |
40-49 Yrs | 1548 (9%) | 4945 (7%) | 10703 (9%) | |
50-59 Yrs | 2009 (12%) | 6730 (10%) | 13364 (11%) | |
60-69 Yrs | 1748 (10%) | 6716 (10%) | 13214 (11%) | |
70+ Yrs | 1759 (10%) | 7768 (12%) | 14328 (12%) | |
Median HH Income | $38,614 | $40,492 | $46,812 | |
Total Household Income | < 24K | 2598 (35%) | 9145 (35%) | 14134 (30%) |
25-49K | 1836 (25%) | 5617 (22%) | 10479 (22%) | |
50-74K | 1256 (17%) | 3826 (15%) | 7728 (16%) | |
75-99K | 683 (9%) | 2498 (9%) | 5089 (10%) | |
100-199K | 789 (10%) | 3374 (13%) | 7338 (15%) | |
200K+ | 79 (1%) | 1005 (3%) | 1855 (3%) | |
Highest Education Level | No Diploma | 1324 | 4528 | 7639 |
Diploma or GED | 3596 | 10560 | 20510 | |
Some College | 2009 | 6204 | 11910 | |
Assoc. Degree | 1471 | 4142 | 8215 | |
Bachelors Degree | 1442 | 6279 | 12243 | |
Higher Degree | 1045 | 5749 | 10786 | |
Total Housing Units | 8,301 | 29,951 | 53,273 | |
--Owner-Occupied | 3,822 | 11,958 | 25,680 | |
--Renter-Occupied | 3,419 | 13,507 | 20,942 | |
Owner-Occupied Values | < 100K | 2428 | 5191 | 10602 |
100-199K | 1202 | 4783 | 10308 | |
200-299K | 74 | 1203 | 2980 | |
300-399K | 18 | 305 | 745 | |
400-499K | 18 | 215 | 374 | |
500K+ | 82 | 260 | 671 | |
Total Working Age Population | 13,346 | 54,295 | 95,339 | |
In Work Force | 8,261 | 28,493 | 52,395 | |
Not In Work Force | 5,085 | 25,801 | 42,944 | |
Workforce Employed | 7,129 | 25,489 | 47,717 | |
Workforce Unemployed | 1,133 | 3,000 | 4,664 | |
Civlian Workforce | 8,261 | 28,489 | 52,381 | |
Military Workforce | 0 | 4 | 14 | |
Total Households | 7,241 | 25,466 | 46,623 | |
Family Households | 3,607 | 11,525 | 24,564 | |
Non-Family Households | 3,634 | 13,940 | 22,059 | |
Married Couple | 2,375 | 7,562 | 16,670 | |
Other Family | 1,232 | 3,963 | 7,894 | |
Married w/Child | 823 | 2,345 | 5,303 | |
Single Male w/Child | 157 | 408 | 777 | |
Single Female w/Child | 529 | 1,780 | 3,561 |
Population Change Last Two Decades - Plus Projection
2000 | % | 2010 | % | 2020 | % | 2030 | |
---|---|---|---|---|---|---|---|
New York | 18,976,457 | +2 | 19,378,102 | +4 | 20,146,131 | +2 | 20,604,030 |
Broome County | 200,536 | 0 | 200,600 | -4 | 192,262 | -3 | 186,950 |
Total Working Age Population:
Total Households:
Total Working Age Population:
Total Households:
Total Working Age Population:
Total Households: