Industrial Properties
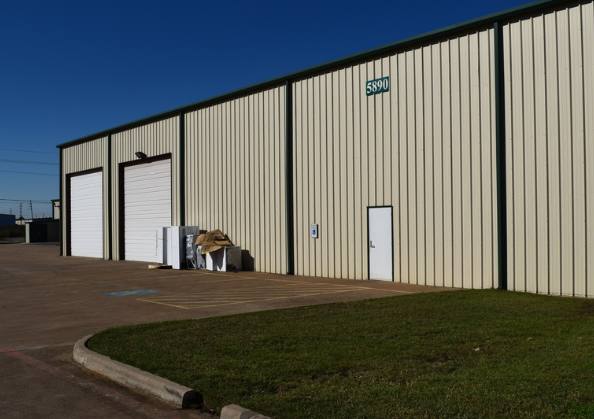
5874 Cunningham Road Houston, TX 77041
5874 Cunningham Road Houston, TX 77041
Details & Description
Property Highlights
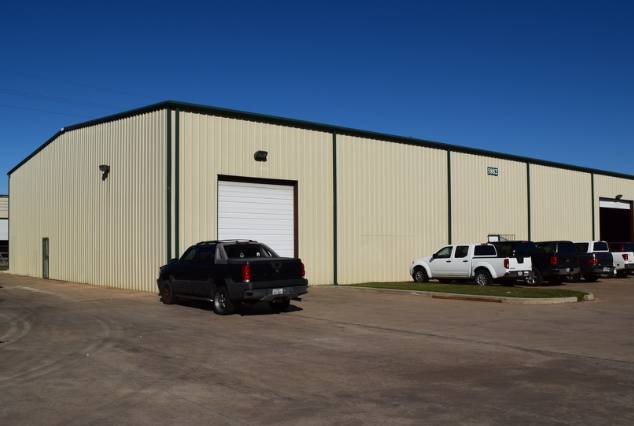
- • +/- 1,000 SF Office
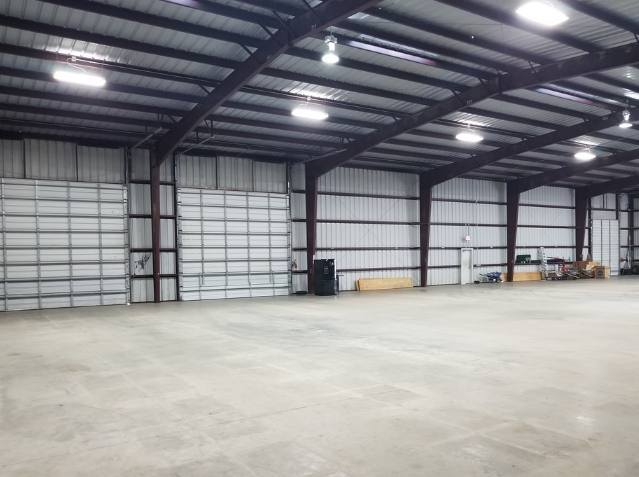
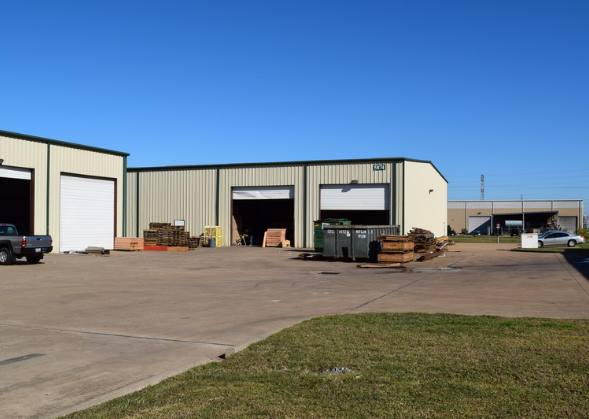
- • Front Loading Warehouse
- • 18’ Eave Height
- • Clear Height: 18'
- • 25' Peak Height
- • Fenced Premises
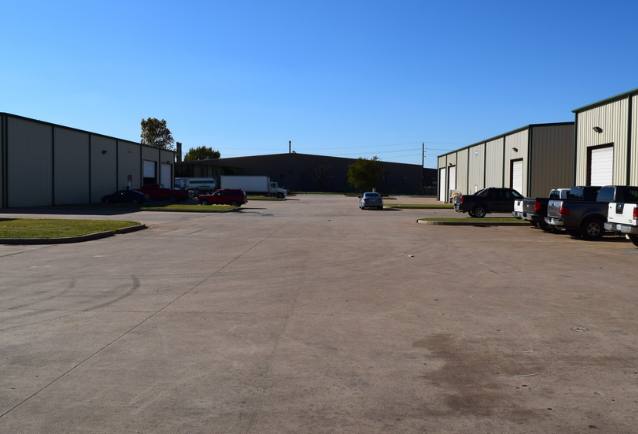
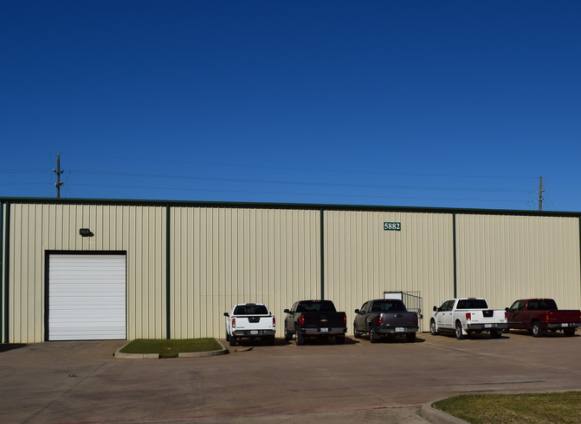
Additional Photos

Listing Agents

Jim Autenreith
O: 713-773-5500
M: 713-773-5593
jautenreith@moodyrambinint.com
O: 713-773-5500
M: 713-773-5593
jautenreith@moodyrambinint.com
While we strive to provide the most accurate information, all listing information, and demographic data, is provided by third-parties. As such, MyEListing will not be responsible for the accuracy of the information. It is strongly recommended that you verify all information with the listing agent, and any relevant agencies, prior to making any decisions.