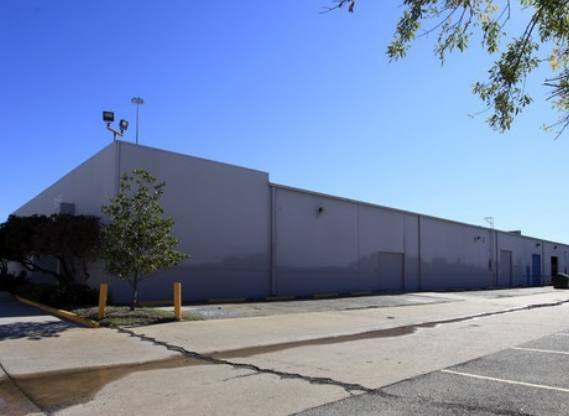
Flex-Office-Warehouse
9159 Wallisville Road Houston, TX 77029
9159 Wallisville Road Houston, TX 77029
Details & Description
Property Highlights
- • Office SF: 3,000 SF
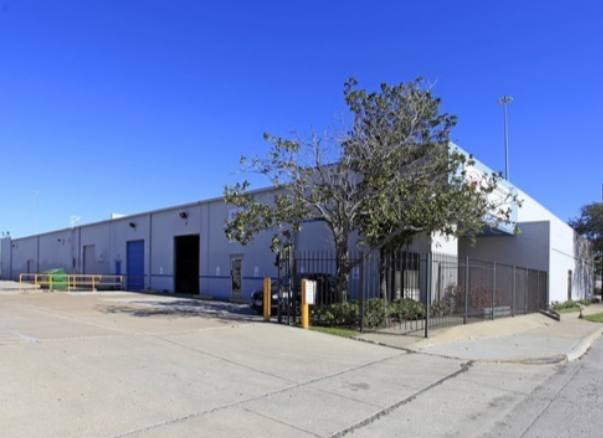
- • Fenced and Gated Premises
- • Tilt Wall Construction
- • Grade Level & Dock High Loading
- • 18' Clear Height
- • Bulk Distribution Warehouse
Additional Photos


Listing Agents

Jim Autenreith
O: 713-773-5500
M: 713-773-5593
jautenreith@moodyrambinint.com
O: 713-773-5500
M: 713-773-5593
jautenreith@moodyrambinint.com

Sam Rayburn
O: 713-373-0441
srayburn@moodyrambinint.com
O: 713-373-0441
srayburn@moodyrambinint.com
While we strive to provide the most accurate information, all listing information, and demographic data, is provided by third-parties. As such, MyEListing will not be responsible for the accuracy of the information. It is strongly recommended that you verify all information with the listing agent, and any relevant agencies, prior to making any decisions.


