Flex-Office-Warehouse
5851 West 34th Street Houston, TX 77092
5851 West 34th Street Houston, TX 77092

Details & Description
Property Highlights
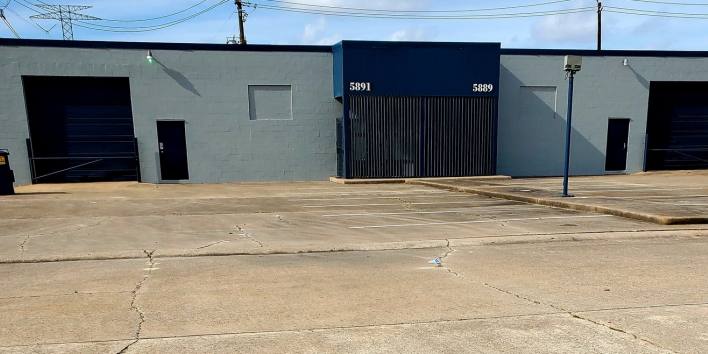
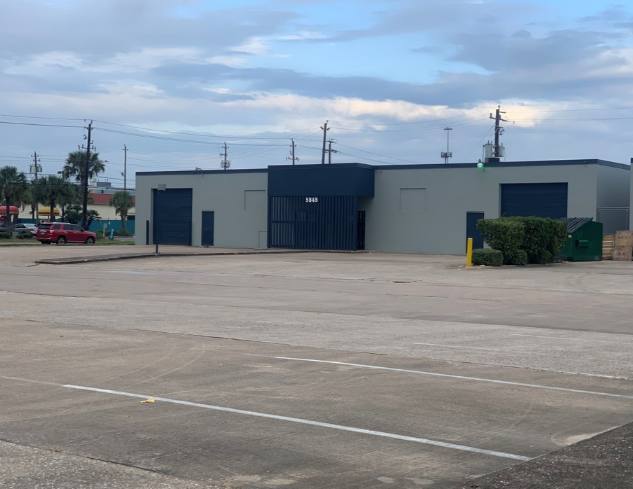
- • Frontage on W 34th Street
- • Signage opportunity
- • Grade level, front loading
- • Loading Doors: 1 (per3,250SF)
- • Ceiling Height: 16'
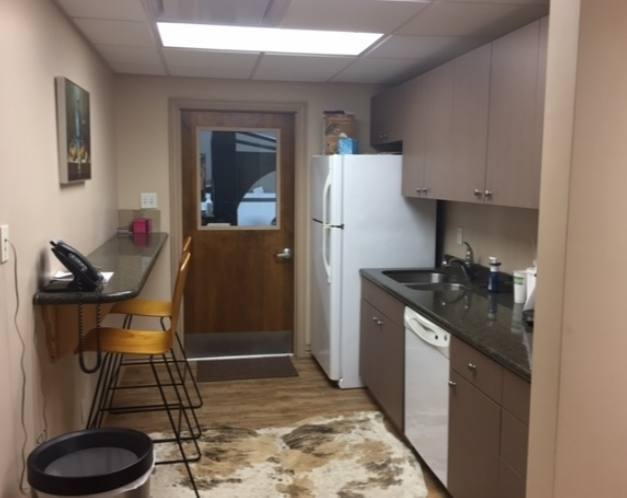
Additional Photos


Listing Agents

Jim Autenreith
O: 713-773-5500
M: 713-773-5593
jautenreith@moodyrambinint.com
O: 713-773-5500
M: 713-773-5593
jautenreith@moodyrambinint.com

Lawton Anderson
O: 713-773-5599
landerson@moodyrambinint.com
O: 713-773-5599
landerson@moodyrambinint.com
While we strive to provide the most accurate information, all listing information, and demographic data, is provided by third-parties. As such, MyEListing will not be responsible for the accuracy of the information. It is strongly recommended that you verify all information with the listing agent, and any relevant agencies, prior to making any decisions.