Industrial Properties
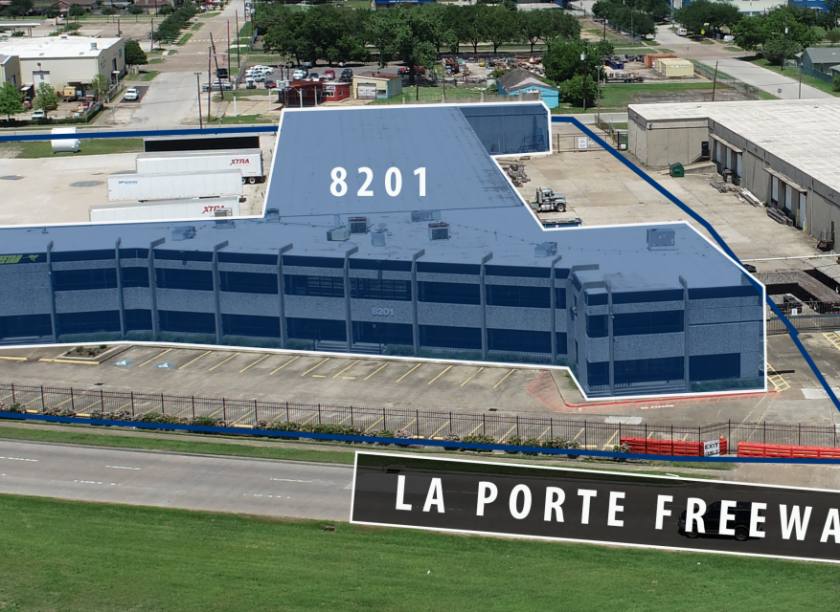
8201 La Porte Freeway Houston, TX 77012
8201 La Porte Freeway Houston, TX 77012
Details & Description
Property Highlights
- • Sprinklered: Yes
- • Power: 3 Phase/480 Volts /2,000 Amps
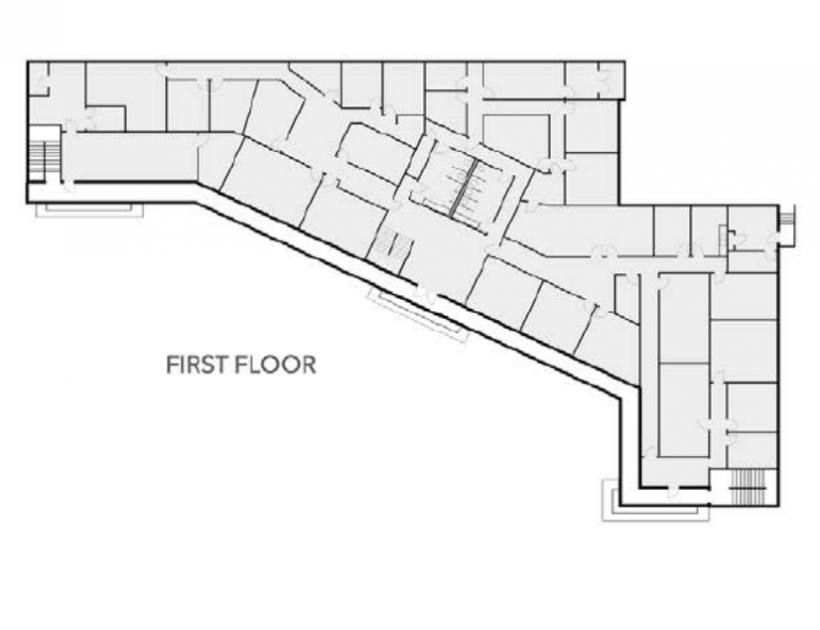
- • Clear Height: +/-20'
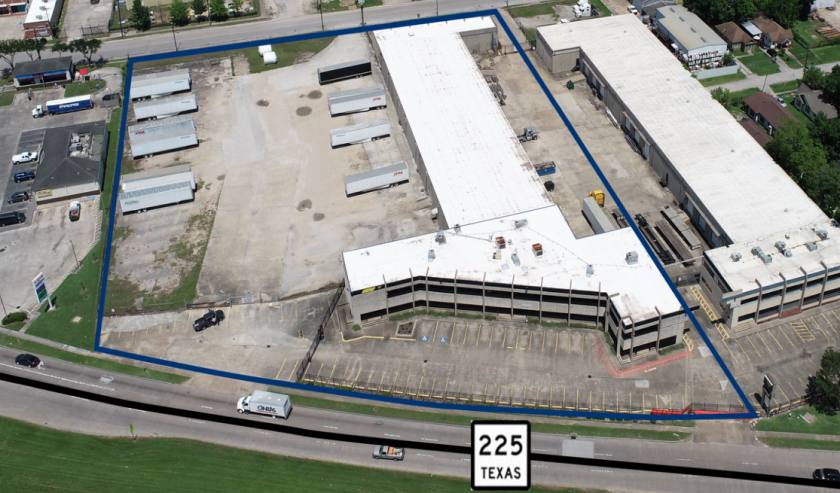
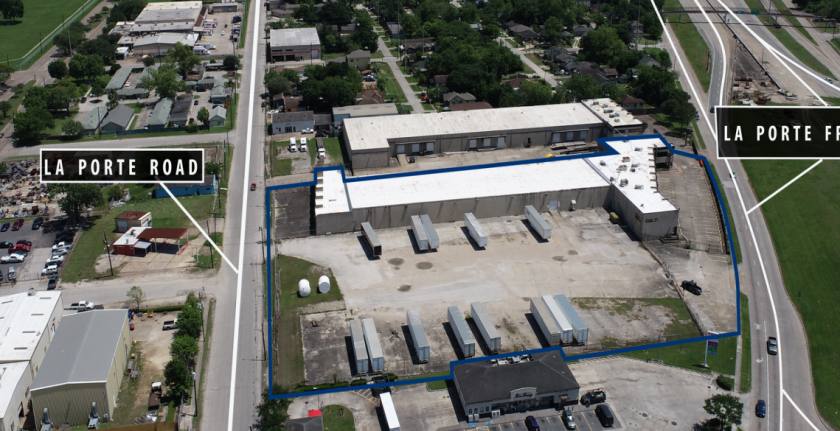
- • Fully Fenced With Electric Gate
- • 430' on La Porte Freeway/SH-225
- • 0.7 Miles to I-610
Additional Photos
Listing Agents

Jim Autenreith
O: 713-773-5500
M: 713-773-5593
jautenreith@moodyrambinint.com
O: 713-773-5500
M: 713-773-5593
jautenreith@moodyrambinint.com

Sam Rayburn
O: 713-373-0441
srayburn@moodyrambinint.com
O: 713-373-0441
srayburn@moodyrambinint.com
While we strive to provide the most accurate information, all listing information, and demographic data, is provided by third-parties. As such, MyEListing will not be responsible for the accuracy of the information. It is strongly recommended that you verify all information with the listing agent, and any relevant agencies, prior to making any decisions.


