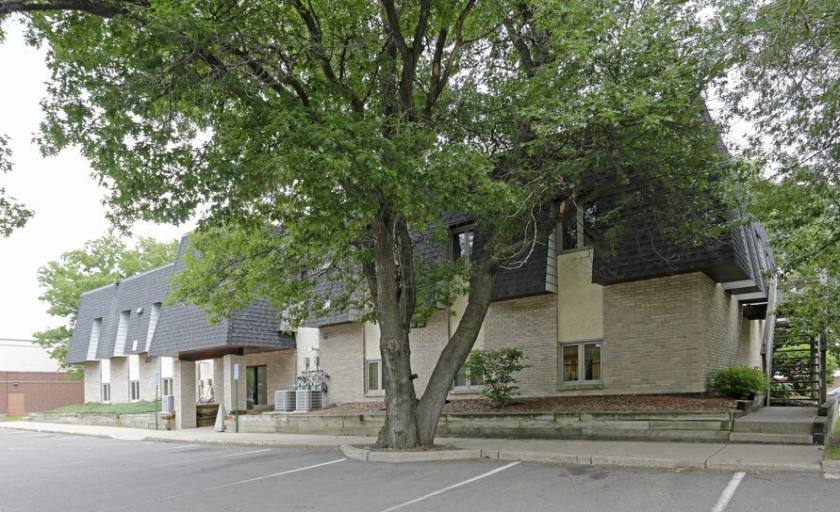
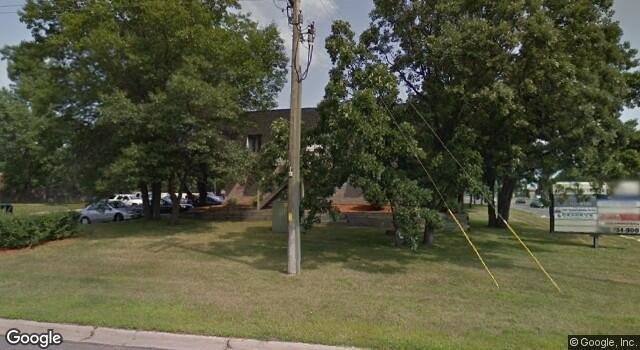
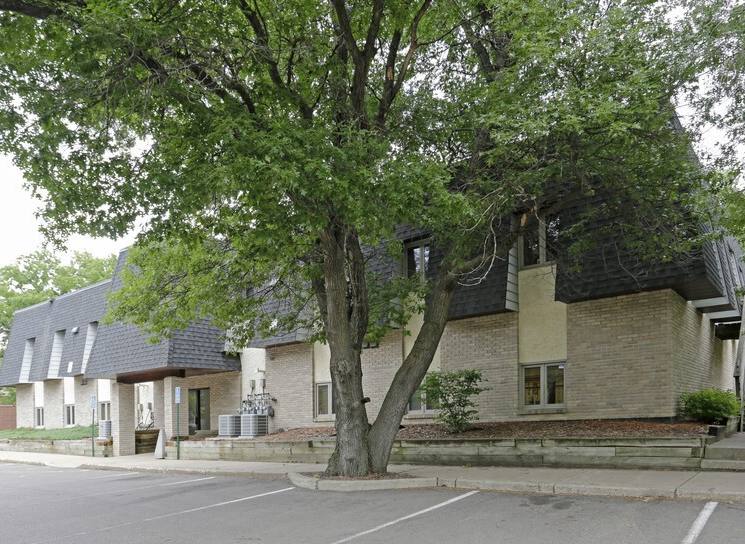
1-Mile | 3-Miles | 5-Miles | ||
---|---|---|---|---|
Total Population | 12,488 | 75,555 | 183,095 | |
Population Median Age | 40 | 39 | 39 | |
Population by Age | 0-9 Yrs | 1411 (11%) | 8980 (11%) | 22898 (12%) |
10-19 Yrs | 1452 (11%) | 9857 (13%) | 24562 (13%) | |
20-29 Yrs | 1741 (13%) | 9781 (12%) | 21559 (11%) | |
30-39 Yrs | 1780 (14%) | 10696 (14%) | 25585 (13%) | |
40-49 Yrs | 1623 (12%) | 9557 (12%) | 24531 (13%) | |
50-59 Yrs | 1756 (14%) | 10252 (13%) | 25316 (13%) | |
60-69 Yrs | 1402 (11%) | 8849 (11%) | 20894 (11%) | |
70+ Yrs | 1324 (10%) | 7583 (10%) | 17750 (9%) | |
Median HH Income | $74,497 | $77,451 | $83,678 | |
Total Household Income | < 24K | 472 (10%) | 3081 (10%) | 6162 (9%) |
25-49K | 977 (21%) | 5576 (19%) | 11853 (17%) | |
50-74K | 877 (18%) | 4974 (17%) | 11622 (17%) | |
75-99K | 886 (19%) | 5290 (18%) | 11603 (17%) | |
100-199K | 1260 (27%) | 8173 (28%) | 21393 (31%) | |
200K+ | 145 (3%) | 1206 (4%) | 4697 (6%) | |
Highest Education Level | No Diploma | 625 | 3126 | 7847 |
Diploma or GED | 3104 | 16867 | 34343 | |
Some College | 1974 | 11885 | 28319 | |
Assoc. Degree | 1196 | 7096 | 16186 | |
Bachelors Degree | 1515 | 9725 | 27512 | |
Higher Degree | 387 | 3517 | 11528 | |
Total Housing Units | 4,658 | 29,252 | 69,769 | |
--Owner-Occupied | 3,919 | 22,549 | 55,012 | |
--Renter-Occupied | 697 | 5,749 | 12,318 | |
Owner-Occupied Values | < 100K | 359 | 2047 | 4084 |
100-199K | 1649 | 8230 | 14500 | |
200-299K | 1695 | 9264 | 22811 | |
300-399K | 155 | 2169 | 8988 | |
400-499K | 20 | 490 | 2712 | |
500K+ | 41 | 349 | 1917 | |
Total Working Age Population | 10,134 | 60,294 | 144,752 | |
In Work Force | 7,199 | 43,043 | 103,389 | |
Not In Work Force | 2,935 | 17,251 | 41,363 | |
Workforce Employed | 6,793 | 41,288 | 99,315 | |
Workforce Unemployed | 405 | 1,731 | 3,993 | |
Civlian Workforce | 7,199 | 43,019 | 103,308 | |
Military Workforce | 0 | 24 | 81 | |
Total Households | 4,616 | 28,299 | 67,331 | |
Family Households | 3,093 | 18,416 | 46,558 | |
Non-Family Households | 1,523 | 9,882 | 20,772 | |
Married Couple | 2,292 | 13,595 | 35,704 | |
Other Family | 802 | 4,821 | 10,854 | |
Married w/Child | 932 | 5,667 | 15,054 | |
Single Male w/Child | 94 | 684 | 1,771 | |
Single Female w/Child | 334 | 1,852 | 4,300 |
Population Change Last Two Decades - Plus Projection
2000 | % | 2010 | % | 2020 | % | 2030 | |
---|---|---|---|---|---|---|---|
Minnesota | 4,919,479 | +8 | 5,303,925 | +7 | 5,687,161 | +5 | 5,974,304 |
Hennepin County | 1,116,200 | +3 | 1,152,425 | +12 | 1,294,371 | +9 | 1,407,332 |
Ramsey County | 511,035 | 0 | 508,640 | +12 | 567,959 | +9 | 616,408 |
Anoka County | 298,084 | +11 | 330,844 | +8 | 358,469 | +6 | 380,651 |
Total Working Age Population:
Total Households:
Total Working Age Population:
Total Households:
Total Working Age Population:
Total Households: