Industrial Properties
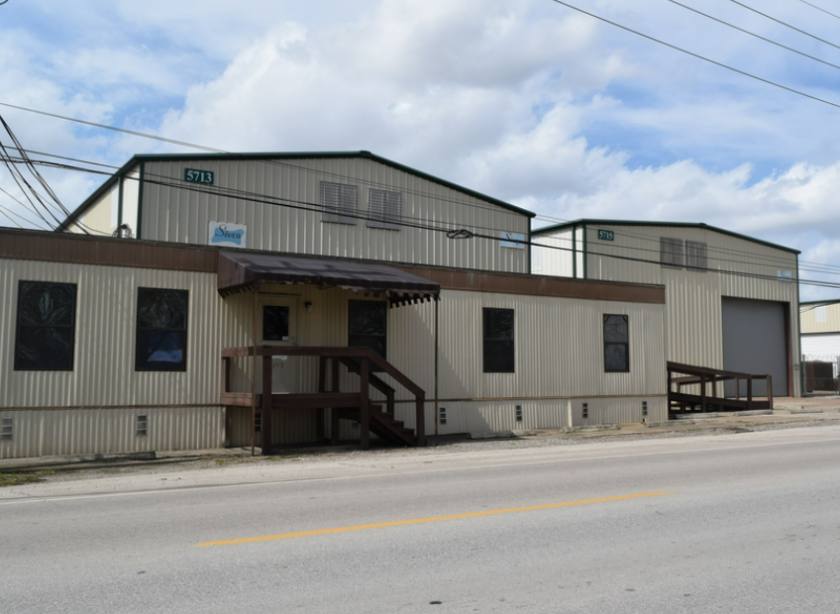
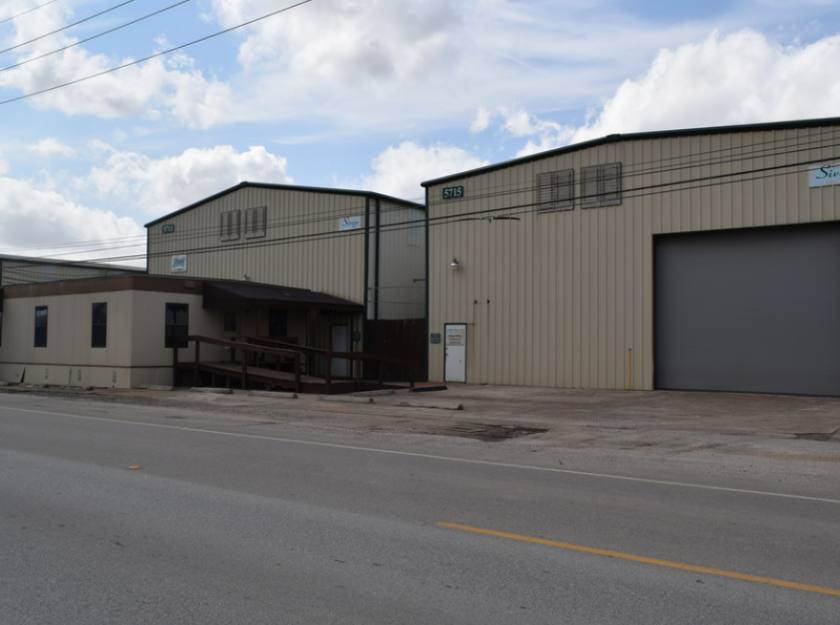
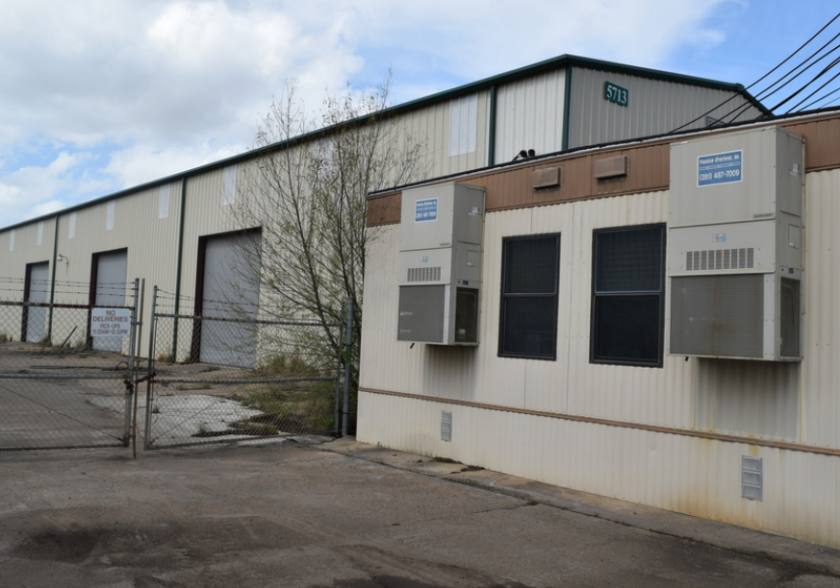
5713 Cunningham Road Houston, TX 77041
5713 Cunningham Road Houston, TX 77041
Details & Description
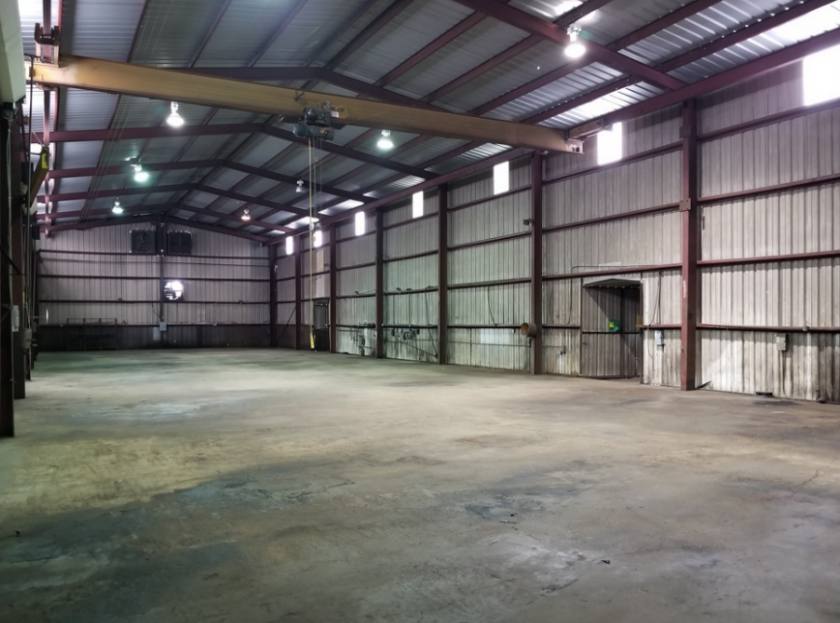
Property Highlights
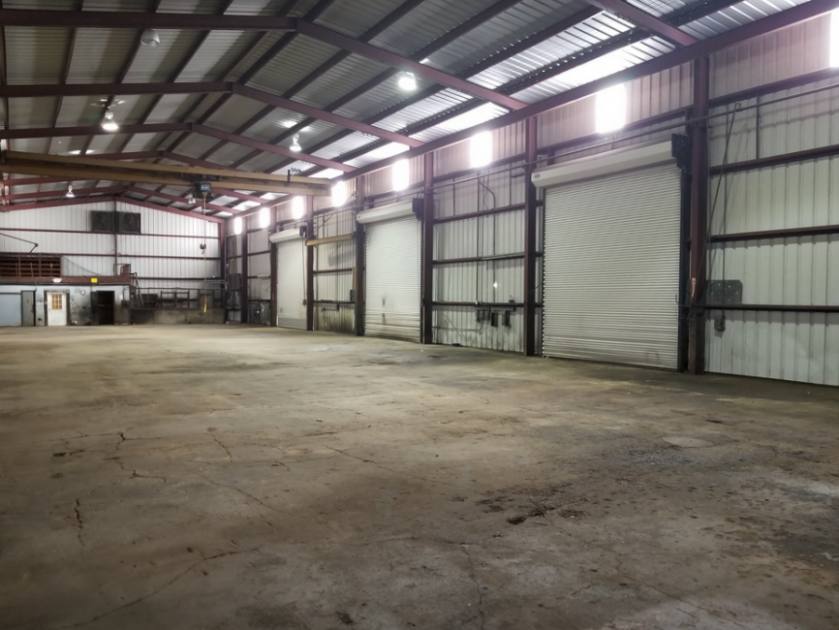
- • Warehouse SF: 9,000 SF
- • Office SF: 1,560 SF
- • Crane Served: (1) 5-Ton
- • 20' Oversized Grade Level Door
- • 480V/600+ Amps Electrical; 3-Phase Power
- • Convenient Access to Beltway 8, 1 Mile East
Additional Photos

Listing Agents

Jim Autenreith
O: 713-773-5500
M: 713-773-5593
jautenreith@moodyrambinint.com
O: 713-773-5500
M: 713-773-5593
jautenreith@moodyrambinint.com

Lawton Anderson
O: 713-773-5599
landerson@moodyrambinint.com
O: 713-773-5599
landerson@moodyrambinint.com
While we strive to provide the most accurate information, all listing information, and demographic data, is provided by third-parties. As such, MyEListing will not be responsible for the accuracy of the information. It is strongly recommended that you verify all information with the listing agent, and any relevant agencies, prior to making any decisions.