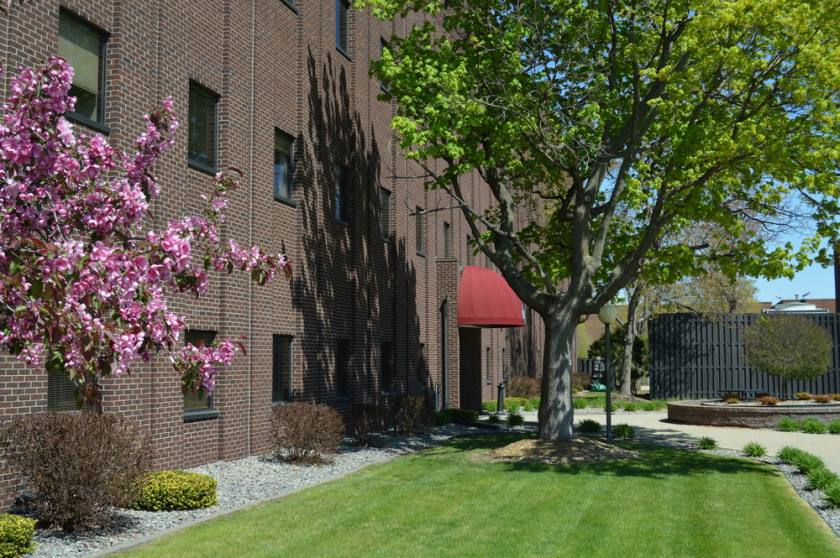
Office Space
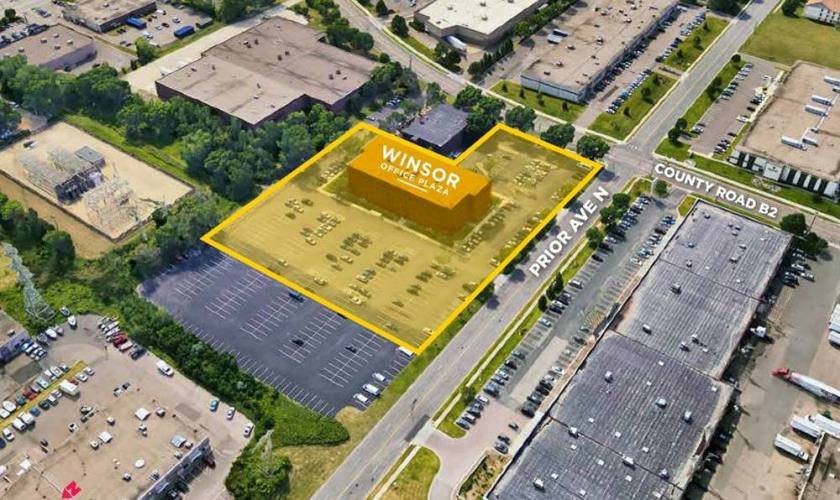
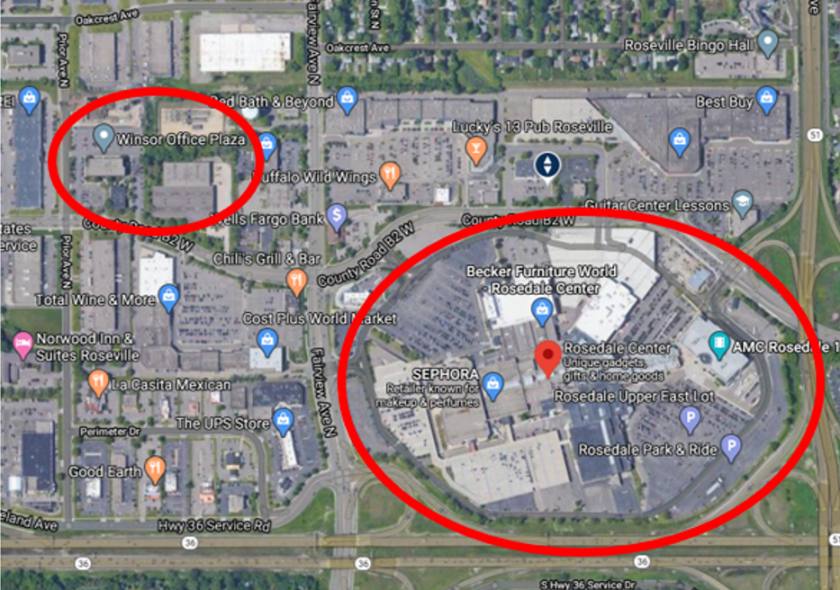
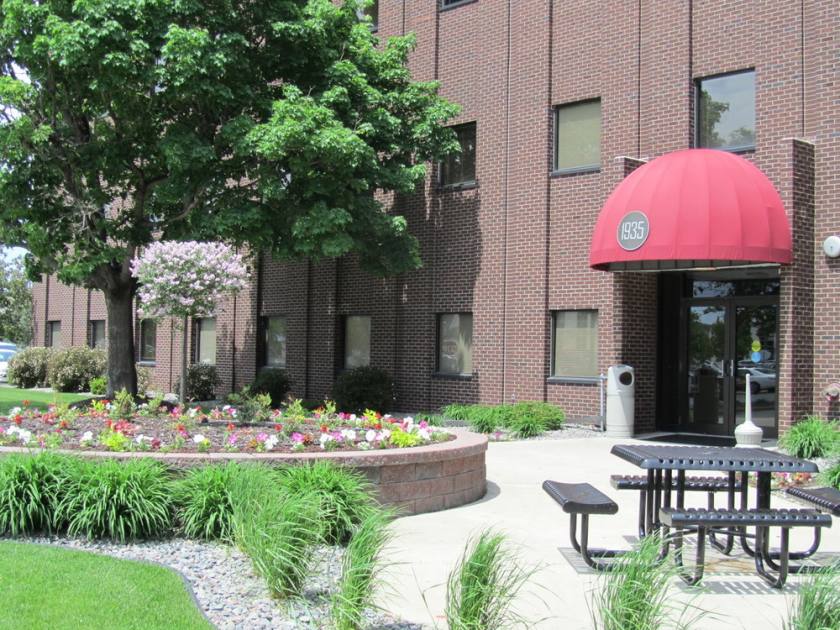
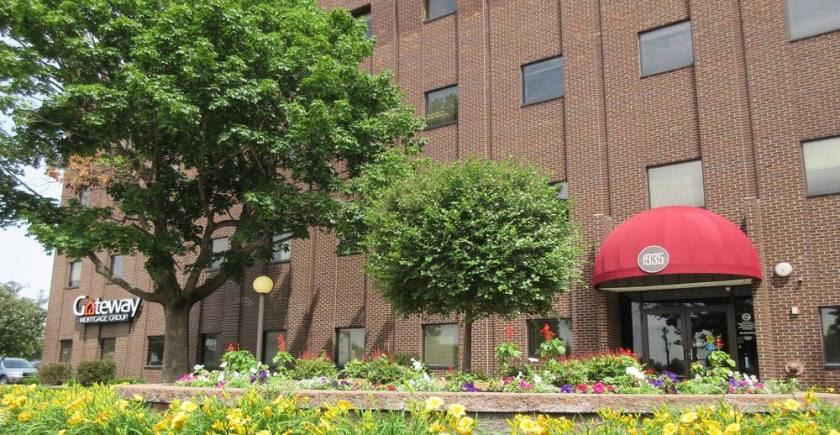
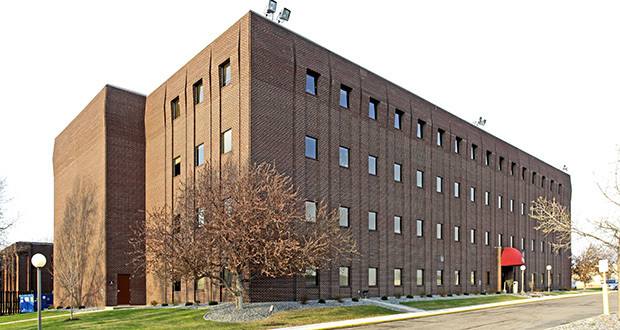
1935 County Road B2 West Saint Paul, MN 55113
1935 County Road B2 West Saint Paul, MN 55113

Details & Description
Property Highlights
- • CAM/Taxes (2020): Estimated at $10.71/RSF
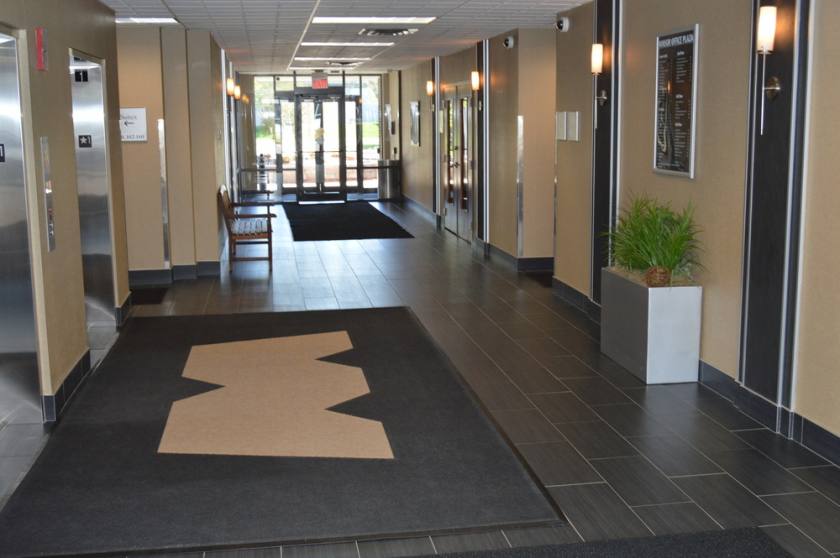
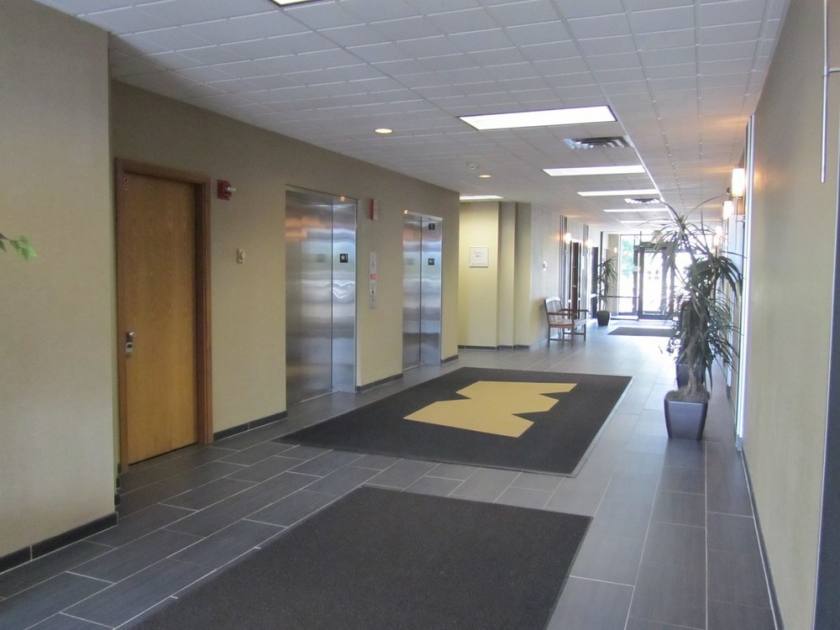
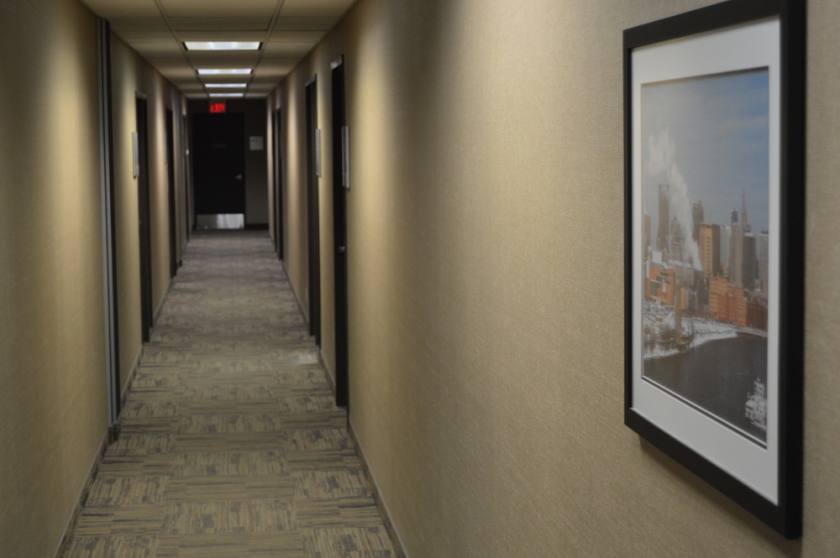
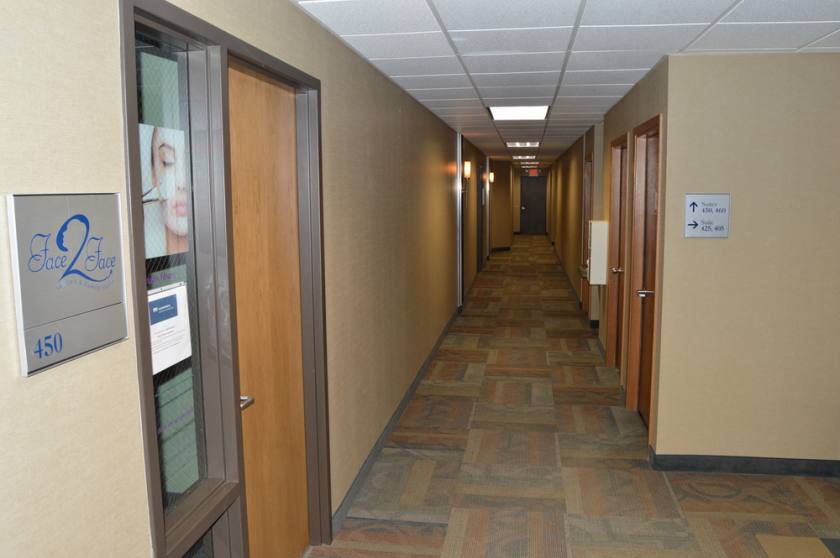
- • New commom area finishes
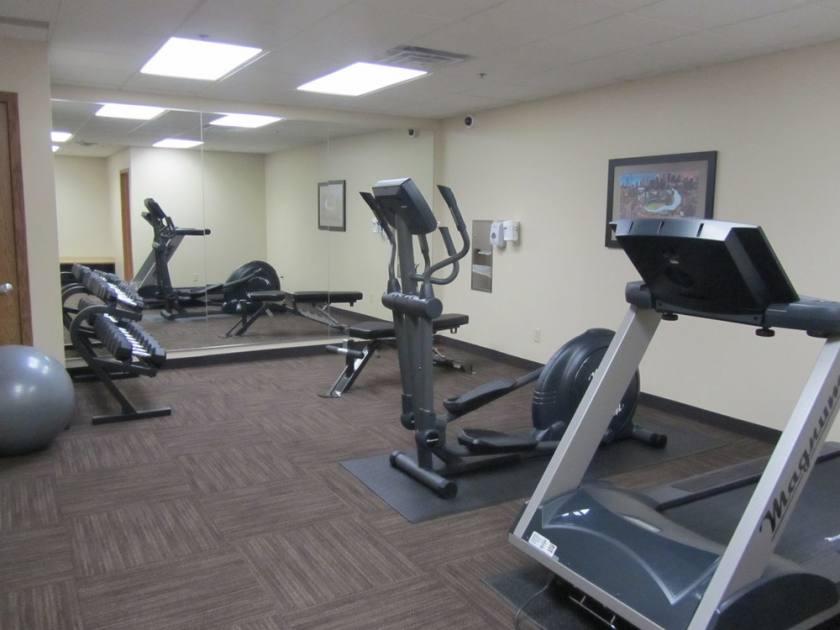
- • On-site fitness center
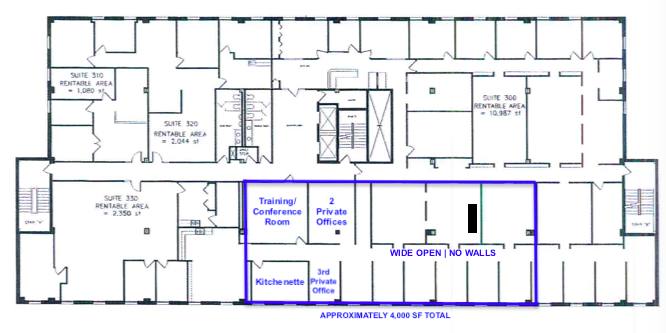
- • Conference/training facility
- • Vending and break areas
- • Direct access to both I-35 and CR 36
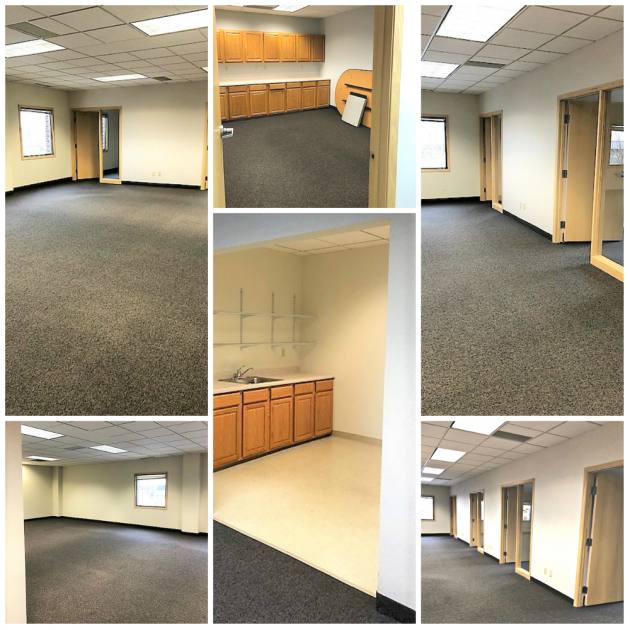
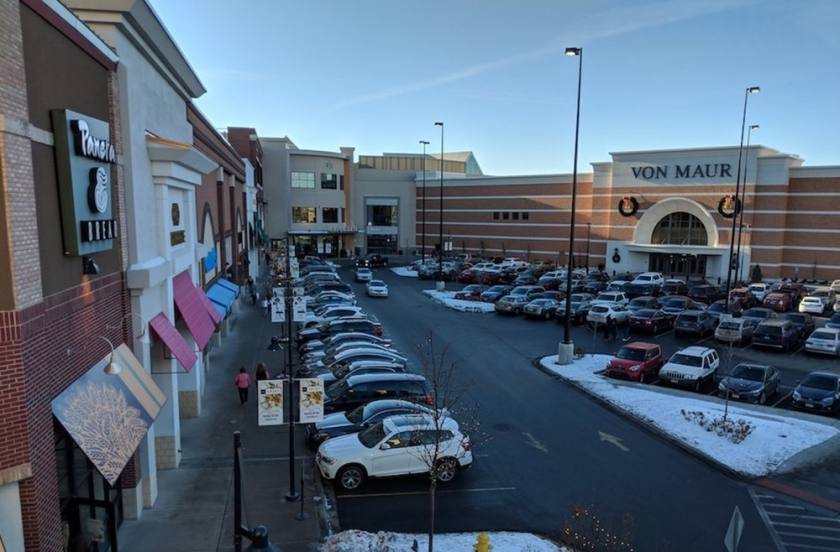
Additional Photos
Listing Agents

Chad Heer
The Summit Group of KW Commerc
O: 612-963-5147
summitcregroup@gmail.com
The Summit Group of KW Commerc
O: 612-963-5147
summitcregroup@gmail.com
While we strive to provide the most accurate information, all listing information, and demographic data, is provided by third-parties. As such, MyEListing will not be responsible for the accuracy of the information. It is strongly recommended that you verify all information with the listing agent, and any relevant agencies, prior to making any decisions.