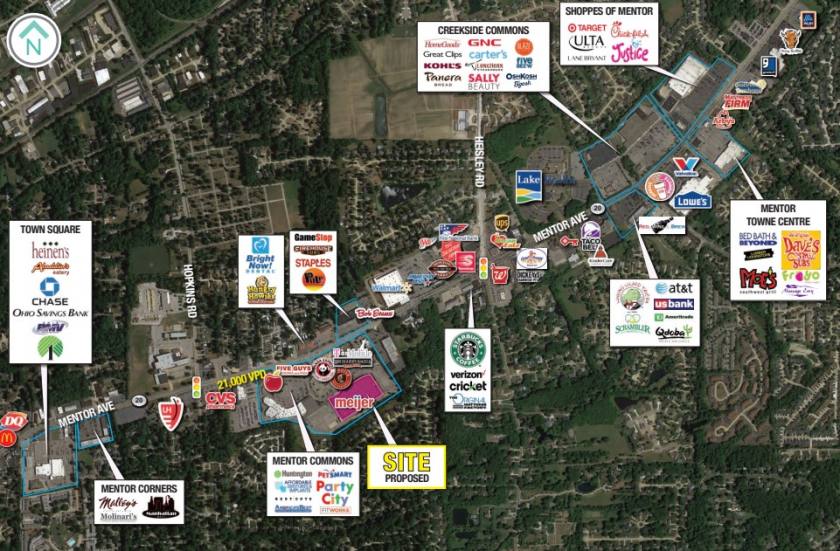
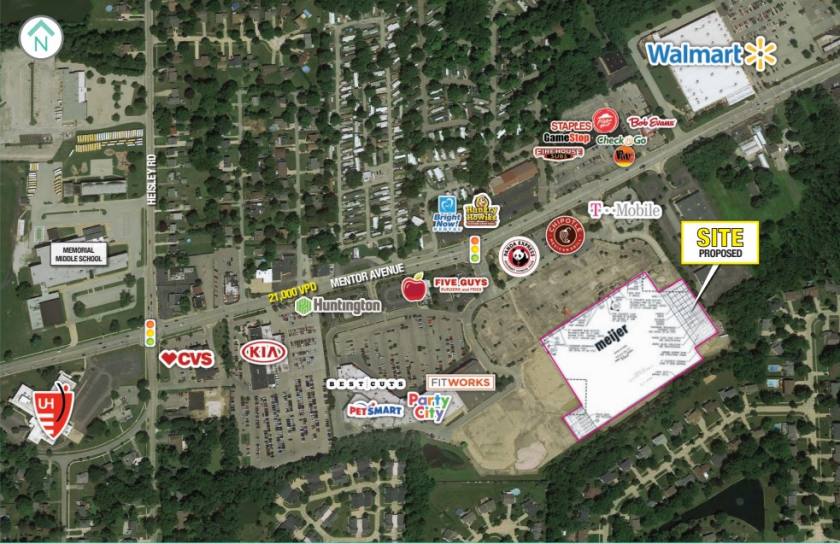
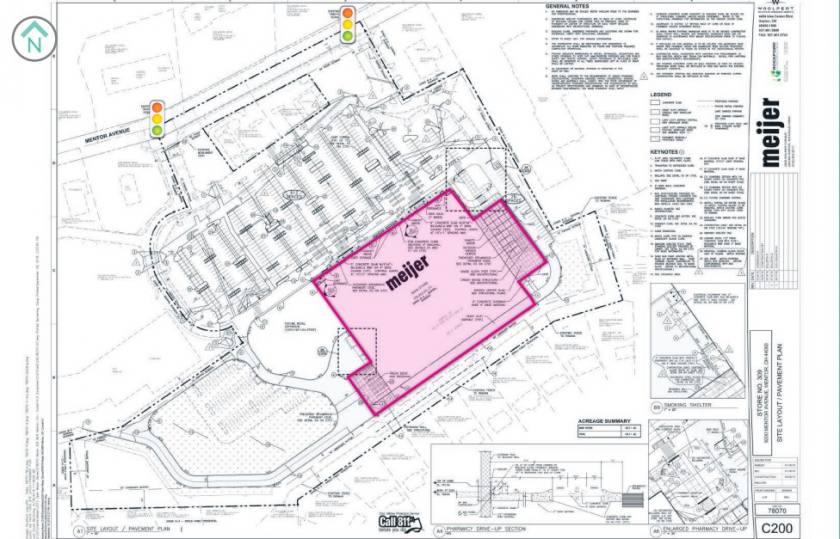
1-Mile | 3-Miles | 5-Miles | ||
---|---|---|---|---|
Total Population | 6,646 | 39,604 | 103,785 | |
Population Median Age | 47 | 45 | 42 | |
Population by Age | 0-9 Yrs | 723 (10%) | 4094 (10%) | 11168 (10%) |
10-19 Yrs | 497 (7%) | 4364 (11%) | 12858 (12%) | |
20-29 Yrs | 522 (7%) | 3598 (9%) | 11190 (10%) | |
30-39 Yrs | 831 (12%) | 4316 (10%) | 11722 (11%) | |
40-49 Yrs | 673 (10%) | 4837 (12%) | 12861 (12%) | |
50-59 Yrs | 848 (12%) | 5286 (13%) | 14839 (14%) | |
60-69 Yrs | 994 (14%) | 6107 (15%) | 14798 (14%) | |
70+ Yrs | 1558 (23%) | 7002 (17%) | 14348 (13%) | |
Median HH Income | $74,055 | $78,893 | $71,236 | |
Total Household Income | < 24K | 349 (12%) | 2084 (12%) | 5668 (13%) |
25-49K | 611 (21%) | 3044 (18%) | 8800 (20%) | |
50-74K | 463 (16%) | 2669 (16%) | 7760 (18%) | |
75-99K | 385 (13%) | 2811 (17%) | 6707 (15%) | |
100-199K | 787 (28%) | 4727 (28%) | 10484 (24%) | |
200K+ | 212 (7%) | 1134 (6%) | 2840 (6%) | |
Highest Education Level | No Diploma | 303 | 1522 | 5305 |
Diploma or GED | 1636 | 7768 | 21803 | |
Some College | 954 | 6592 | 16628 | |
Assoc. Degree | 336 | 2696 | 7365 | |
Bachelors Degree | 1229 | 6543 | 14590 | |
Higher Degree | 780 | 4334 | 8753 | |
Total Housing Units | 2,990 | 17,542 | 44,885 | |
--Owner-Occupied | 2,403 | 13,550 | 31,946 | |
--Renter-Occupied | 403 | 2,920 | 10,312 | |
Owner-Occupied Values | < 100K | 433 | 1729 | 4838 |
100-199K | 660 | 5114 | 13442 | |
200-299K | 1051 | 5115 | 8852 | |
300-399K | 160 | 1100 | 2956 | |
400-499K | 92 | 313 | 897 | |
500K+ | 8 | 180 | 962 | |
Total Working Age Population | 5,581 | 32,649 | 84,706 | |
In Work Force | 3,170 | 19,914 | 54,038 | |
Not In Work Force | 2,411 | 12,735 | 30,668 | |
Workforce Employed | 3,053 | 19,176 | 51,881 | |
Workforce Unemployed | 117 | 739 | 2,115 | |
Civlian Workforce | 3,170 | 19,914 | 53,997 | |
Military Workforce | 0 | 0 | 41 | |
Total Households | 2,806 | 16,470 | 42,258 | |
Family Households | 1,849 | 10,718 | 27,232 | |
Non-Family Households | 957 | 5,753 | 15,026 | |
Married Couple | 1,507 | 8,713 | 21,224 | |
Other Family | 342 | 2,005 | 6,008 | |
Married w/Child | 530 | 2,910 | 7,309 | |
Single Male w/Child | 48 | 371 | 909 | |
Single Female w/Child | 66 | 544 | 2,147 |
Population Change Last Two Decades - Plus Projection
2000 | % | 2010 | % | 2020 | % | 2030 | |
---|---|---|---|---|---|---|---|
Ohio | 11,353,140 | +2 | 11,536,504 | 0 | 11,574,870 | 0 | 11,615,100 |
Lake County | 227,511 | +1 | 230,041 | -1 | 228,600 | 0 | 228,380 |
Geauga County | 90,895 | +3 | 93,389 | 0 | 93,510 | +2 | 94,930 |
Total Working Age Population:
Total Households:
Total Working Age Population:
Total Households:
Total Working Age Population:
Total Households: