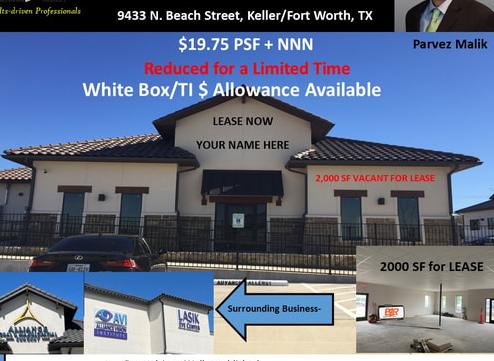
1-Mile | 3-Miles | 5-Miles | ||
---|---|---|---|---|
Total Population | 18,172 | 118,698 | 271,012 | |
Population Median Age | 36 | 34 | 35 | |
Population by Age | 0-9 Yrs | 2404 (13%) | 18076 (15%) | 41145 (15%) |
10-19 Yrs | 3246 (17%) | 17943 (15%) | 40749 (15%) | |
20-29 Yrs | 1142 (6%) | 14009 (11%) | 32531 (12%) | |
30-39 Yrs | 2607 (14%) | 18968 (15%) | 43568 (16%) | |
40-49 Yrs | 3366 (18%) | 18801 (15%) | 40366 (14%) | |
50-59 Yrs | 2261 (12%) | 15639 (13%) | 34261 (12%) | |
60-69 Yrs | 2531 (13%) | 9896 (8%) | 23913 (8%) | |
70+ Yrs | 614 (3%) | 5366 (4%) | 14478 (5%) | |
Median HH Income | $126,319 | $101,049 | $94,725 | |
Total Household Income | < 24K | 259 (4%) | 2122 (5%) | 6243 (6%) |
25-49K | 470 (8%) | 4048 (10%) | 11186 (12%) | |
50-74K | 365 (6%) | 6027 (15%) | 14970 (16%) | |
75-99K | 1185 (21%) | 6821 (17%) | 16618 (18%) | |
100-199K | 2302 (42%) | 15730 (40%) | 32312 (35%) | |
200K+ | 828 (15%) | 3715 (9%) | 9695 (10%) | |
Highest Education Level | No Diploma | 512 | 3923 | 10775 |
Diploma or GED | 1487 | 15065 | 35895 | |
Some College | 2372 | 18552 | 41988 | |
Assoc. Degree | 709 | 6577 | 15620 | |
Bachelors Degree | 4600 | 22966 | 49446 | |
Higher Degree | 2078 | 8605 | 20067 | |
Total Housing Units | 5,726 | 40,542 | 95,085 | |
--Owner-Occupied | 4,515 | 27,791 | 65,604 | |
--Renter-Occupied | 893 | 10,673 | 25,421 | |
Owner-Occupied Values | < 100K | 24 | 990 | 3141 |
100-199K | 513 | 7174 | 17968 | |
200-299K | 2350 | 12505 | 25320 | |
300-399K | 1165 | 5279 | 11143 | |
400-499K | 387 | 1301 | 4753 | |
500K+ | 76 | 542 | 3279 | |
Total Working Age Population | 13,639 | 89,430 | 204,611 | |
In Work Force | 9,883 | 67,884 | 151,118 | |
Not In Work Force | 3,756 | 21,547 | 53,493 | |
Workforce Employed | 9,325 | 64,439 | 143,881 | |
Workforce Unemployed | 558 | 3,385 | 6,830 | |
Civlian Workforce | 9,883 | 67,824 | 150,711 | |
Military Workforce | 0 | 59 | 408 | |
Total Households | 5,408 | 38,463 | 91,025 | |
Family Households | 4,356 | 30,399 | 70,324 | |
Non-Family Households | 1,052 | 8,064 | 20,701 | |
Married Couple | 3,603 | 23,900 | 55,053 | |
Other Family | 753 | 6,499 | 15,271 | |
Married w/Child | 2,022 | 12,759 | 27,597 | |
Single Male w/Child | 166 | 872 | 2,327 | |
Single Female w/Child | 270 | 3,020 | 6,761 |
Population Change Last Two Decades - Plus Projection
2000 | % | 2010 | % | 2020 | % | 2030 | |
---|---|---|---|---|---|---|---|
Texas | 20,851,820 | +21 | 25,145,561 | +18 | 29,677,668 | +18 | 34,894,452 |
Tarrant County | 1,446,219 | +25 | 1,809,034 | +19 | 2,143,755 | +17 | 2,507,170 |
Total Working Age Population:
Total Households:
Total Working Age Population:
Total Households:
Total Working Age Population:
Total Households: