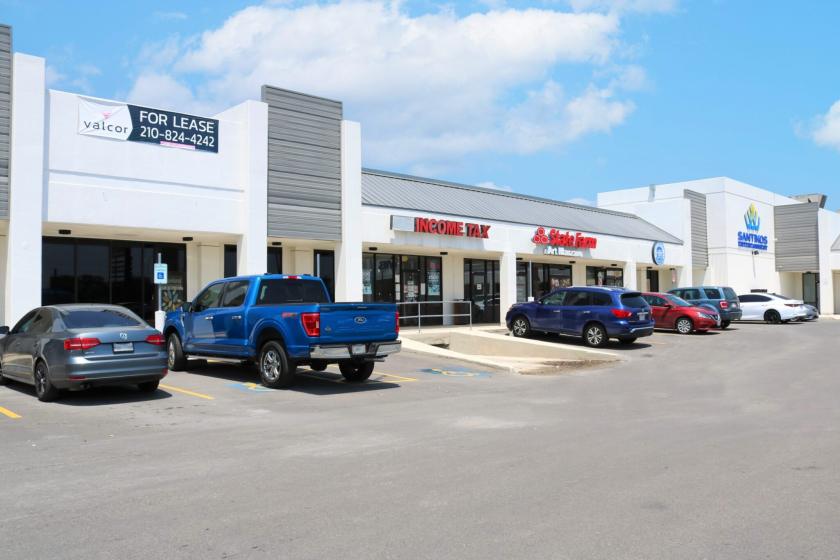
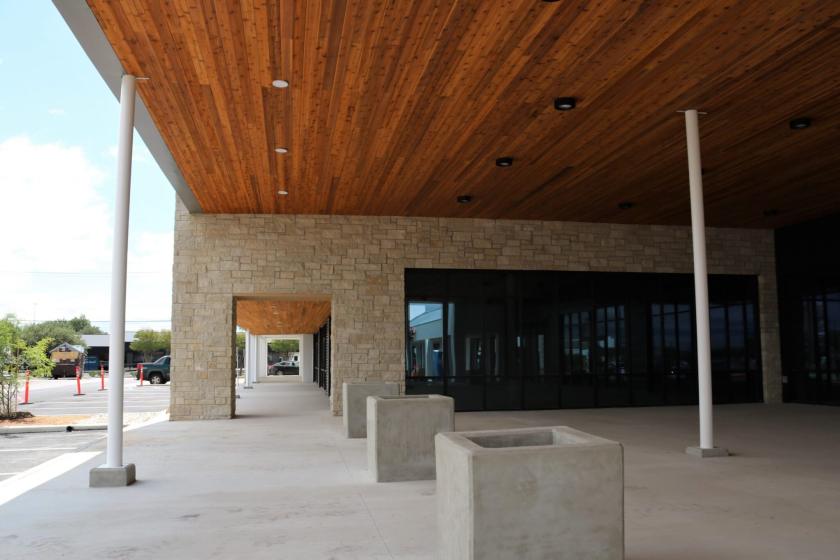
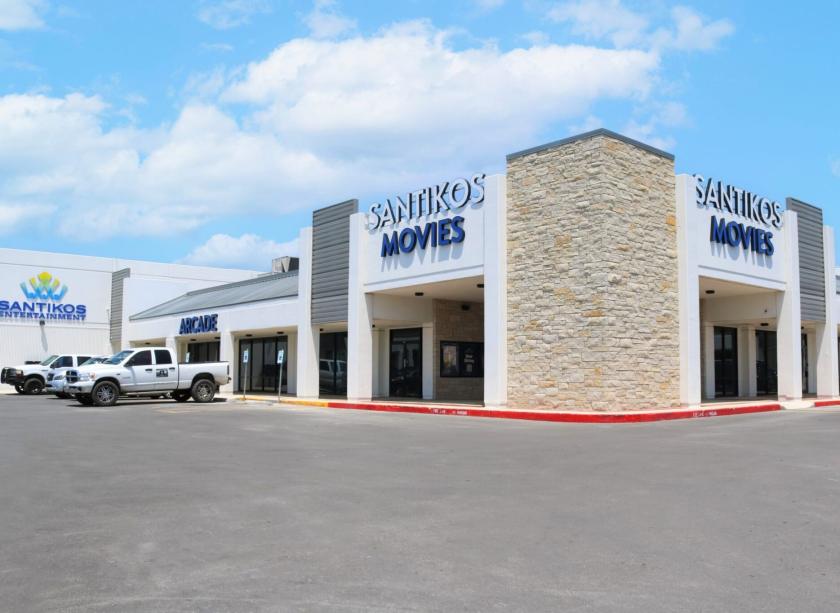
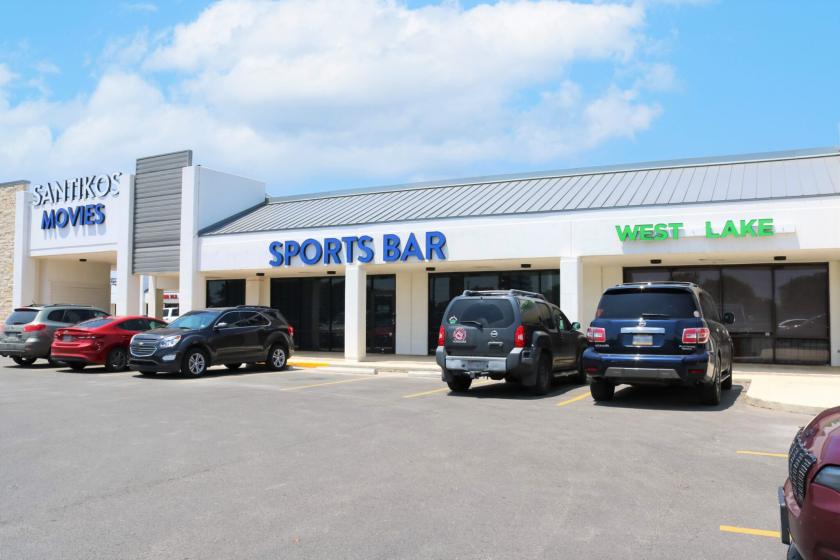
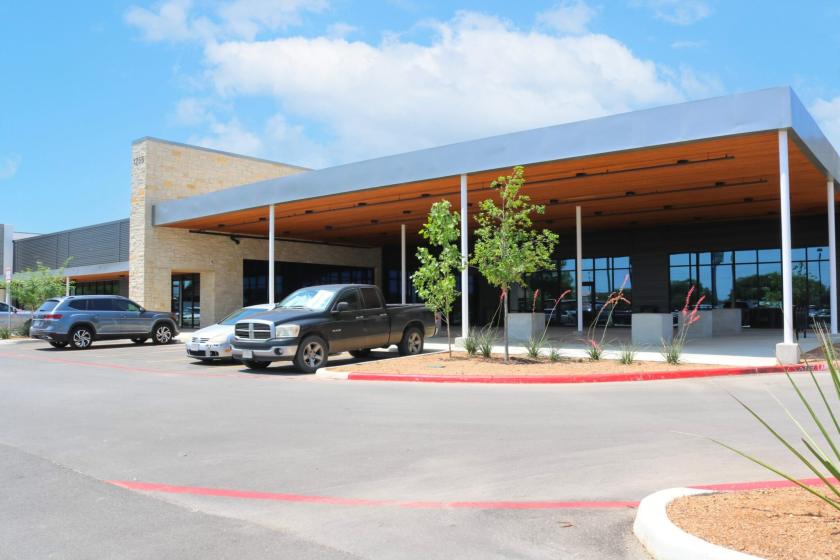
Retail Space
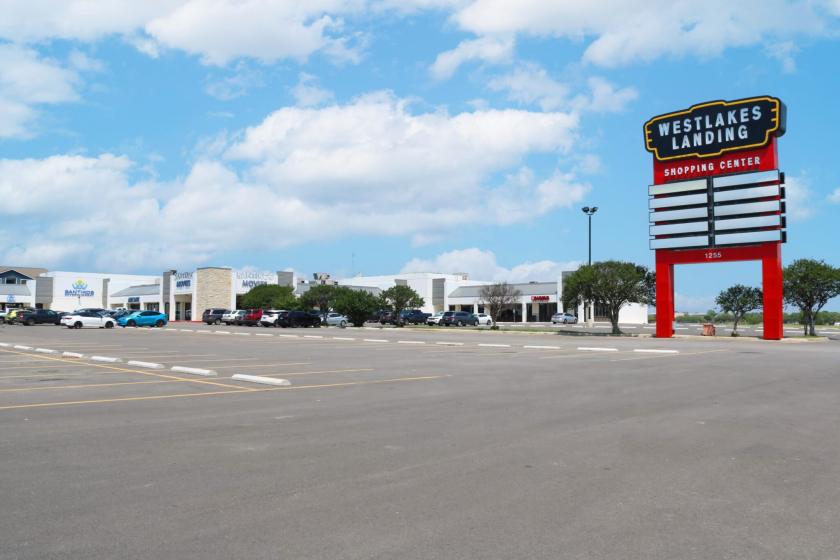
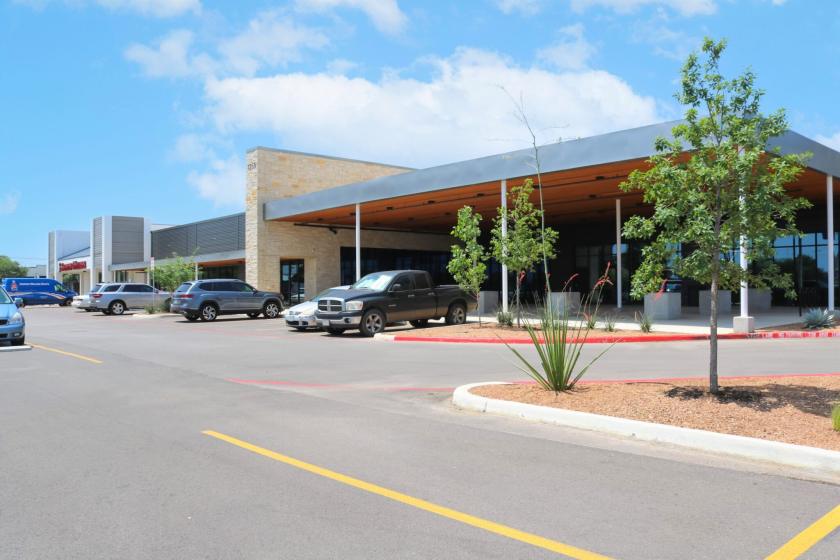
1255 Southwest Loop 410 San Antonio, TX 78227
1255 Southwest Loop 410 San Antonio, TX 78227
Details & Description
Property Highlights
- • Pad Site/Build to Suit
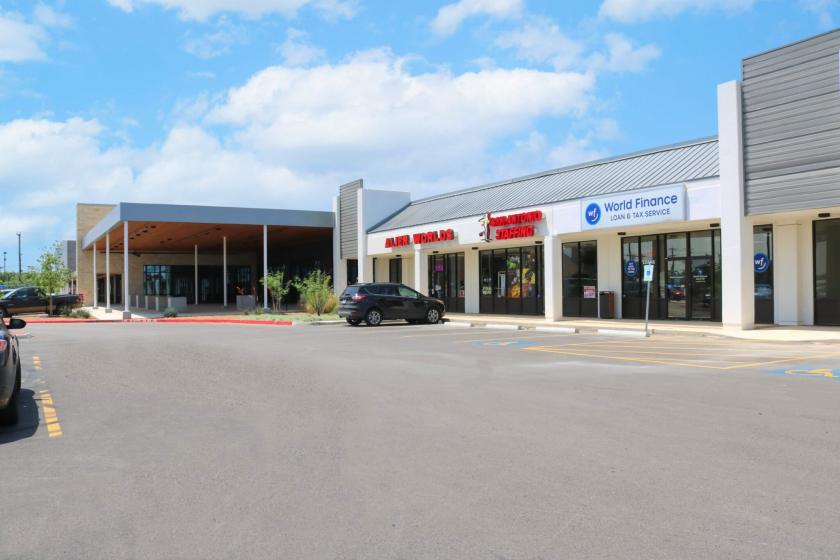
- • New Restaurant
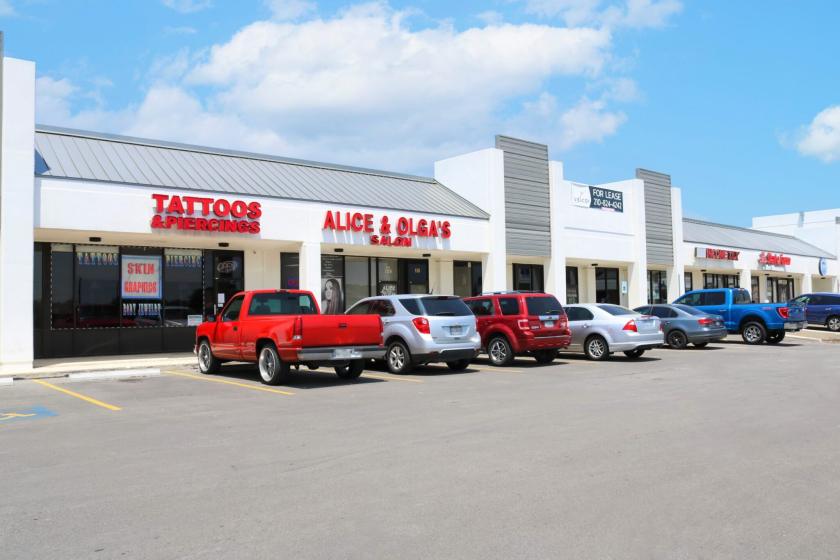
- • New Retail
Additional Photos

Listing Agents

Gary Stephens
O: 210-233-6577
M: 210-445-2000
gary@valcorcre.com
O: 210-233-6577
M: 210-445-2000
gary@valcorcre.com

Adam Schiller
O: 210-742-6681
M: 210-232-4409
adam@valcorcre.com
O: 210-742-6681
M: 210-232-4409
adam@valcorcre.com
While we strive to provide the most accurate information, all listing information, and demographic data, is provided by third-parties. As such, MyEListing will not be responsible for the accuracy of the information. It is strongly recommended that you verify all information with the listing agent, and any relevant agencies, prior to making any decisions.