Office Space
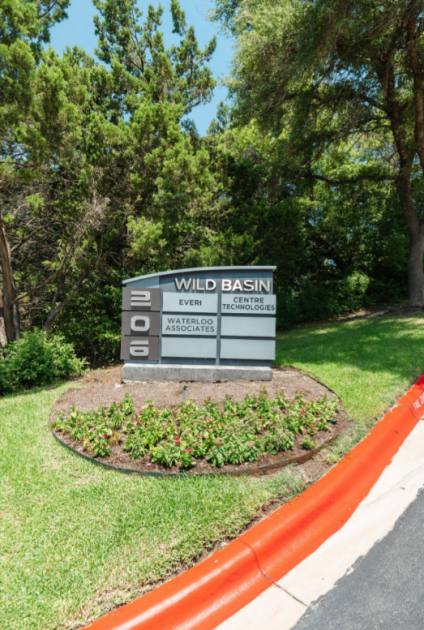
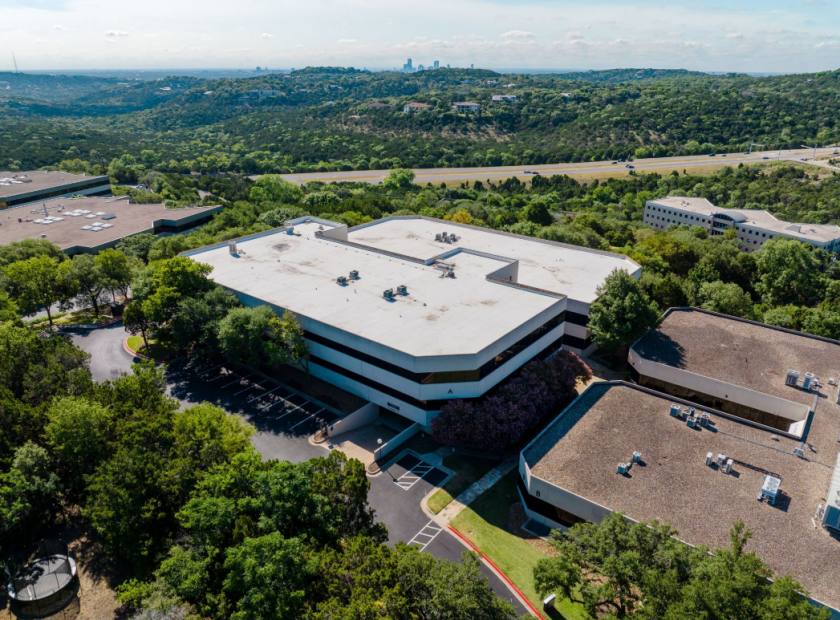
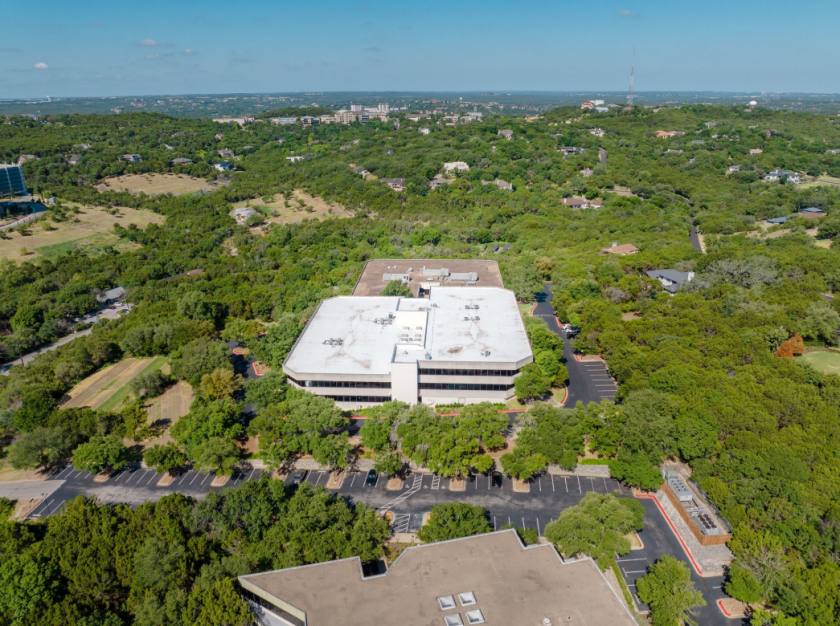
206 Wild Basin Road South Austin, TX 78746
206 Wild Basin Road South Austin, TX 78746
Details & Description
Property Highlights
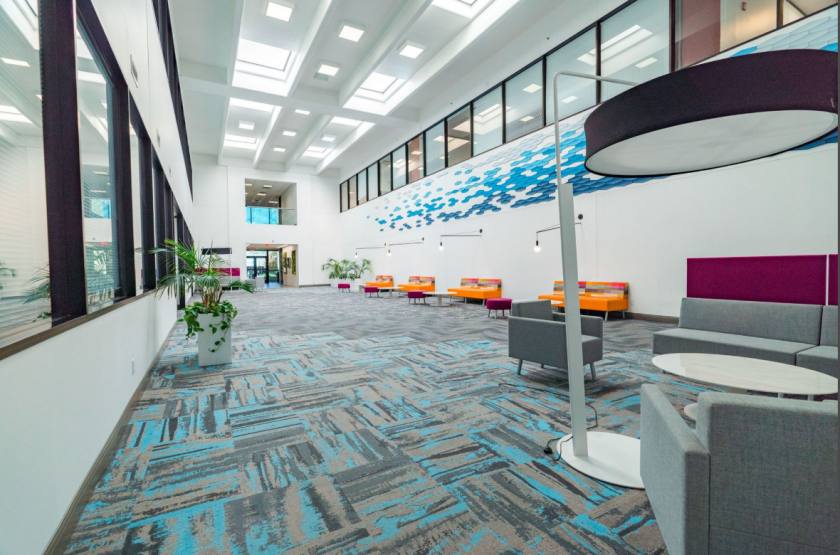
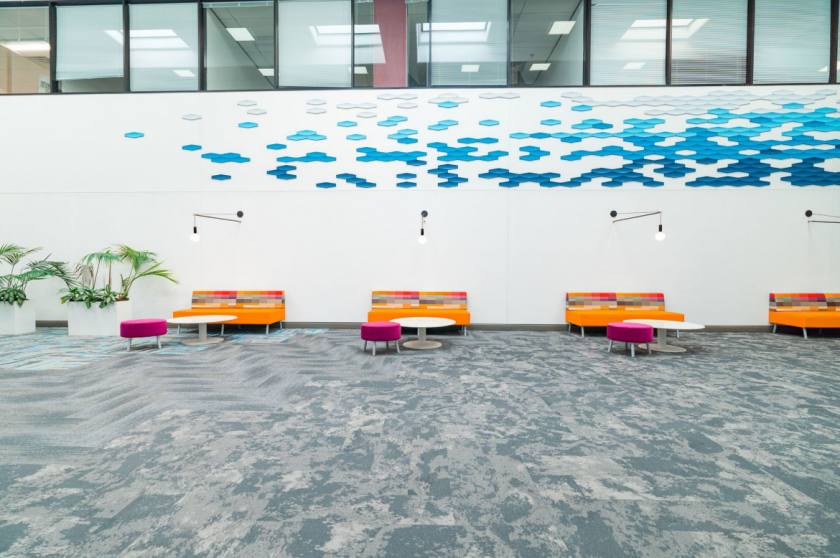
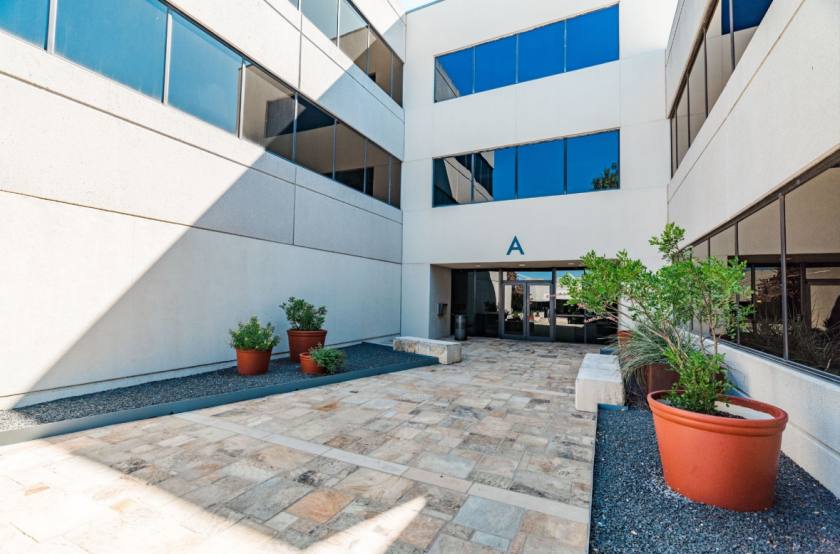
- • NEWLY REMODELED LOBBY
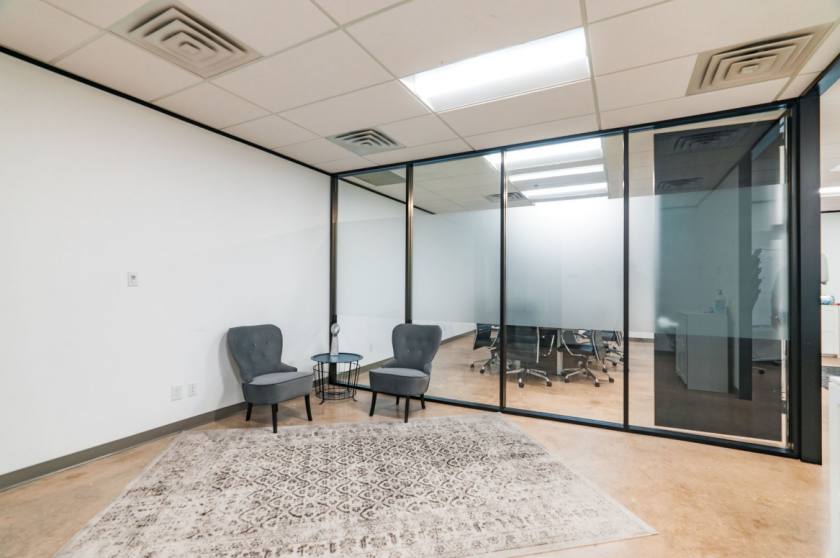
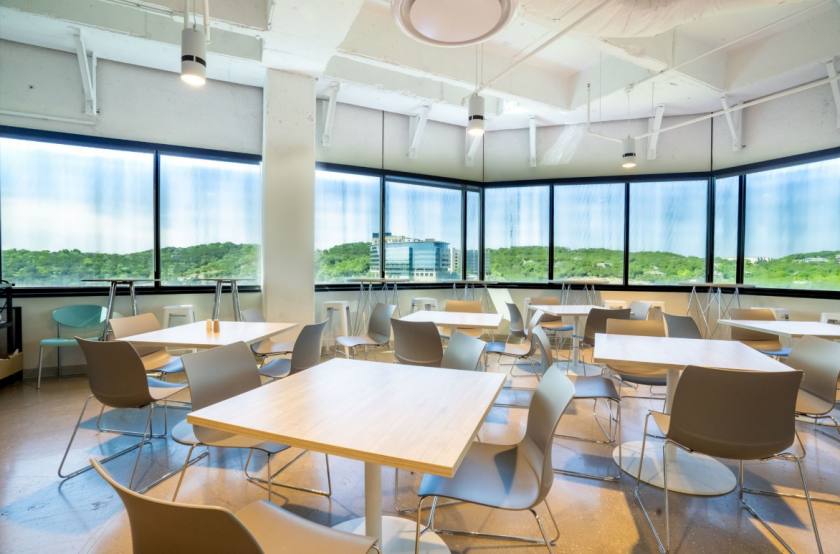
- • MODERN COMMON AREA RENOVATIONS
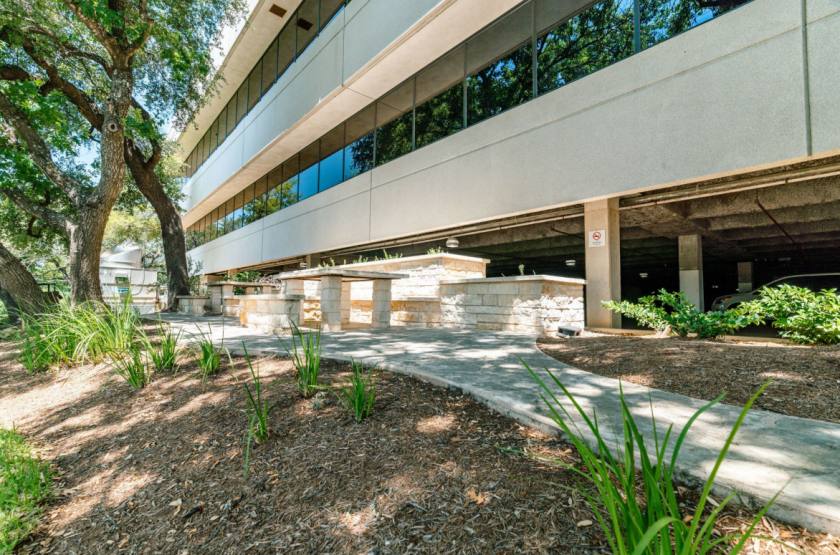
- • OUTDOOR LOUNGE AREA
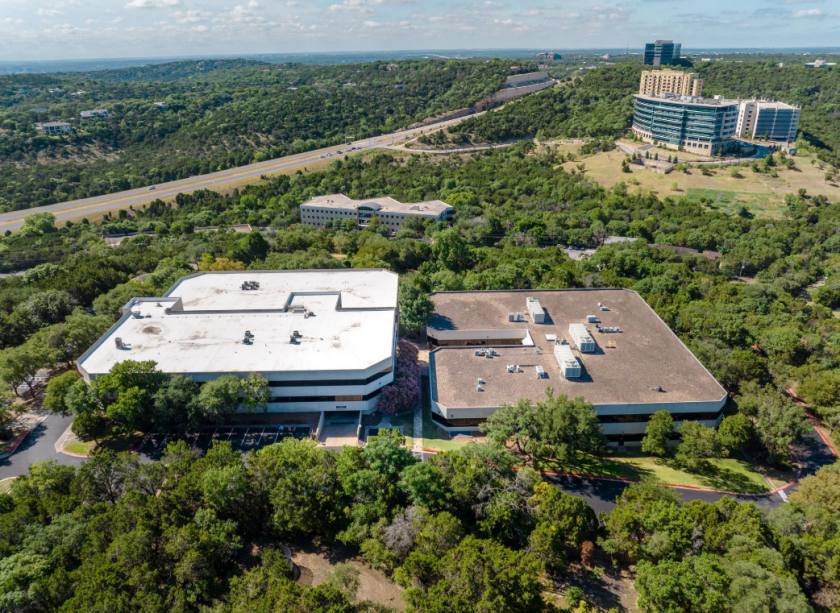
- • CLOSE PROXIMITY TO LOST CREEK & WESTLAKE HILLS
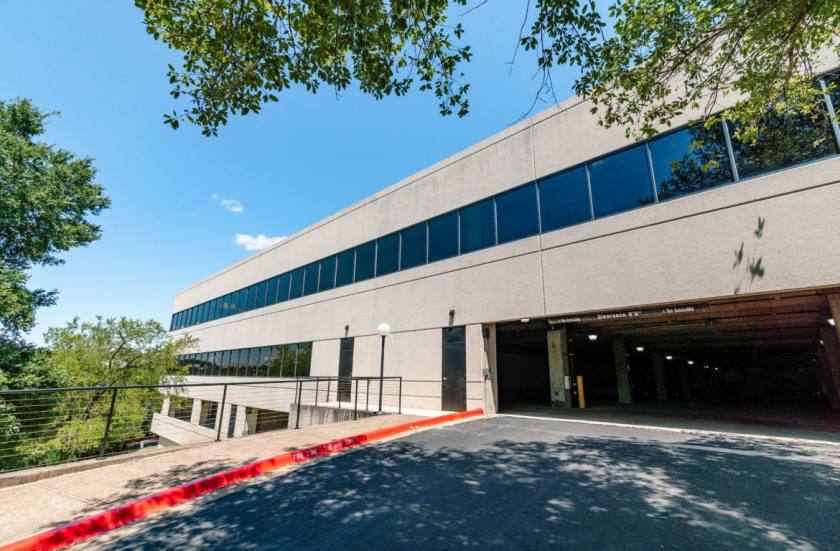
- • EASY ACCESS TO HWY 360 AND BEE CAVES ROAD
- • SHOPPING CENTERS NEARBY
Additional Photos

Listing Agents

John Collins IV
O: 512-391-0718
jcollins@stcroixca.com
O: 512-391-0718
jcollins@stcroixca.com

Michael McKinley
O: 512-391-0718
M: 512-773-6170
mmckinley@stcroixca.com
O: 512-391-0718
M: 512-773-6170
mmckinley@stcroixca.com
While we strive to provide the most accurate information, all listing information, and demographic data, is provided by third-parties. As such, MyEListing will not be responsible for the accuracy of the information. It is strongly recommended that you verify all information with the listing agent, and any relevant agencies, prior to making any decisions.