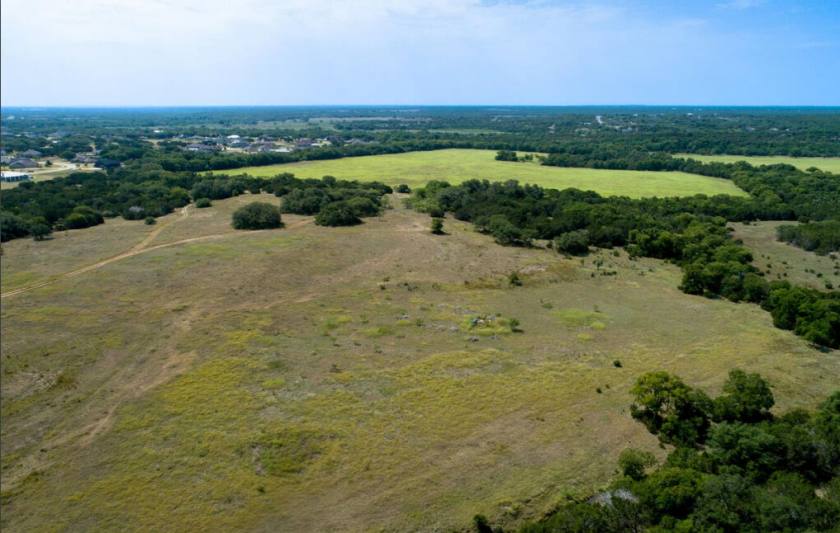
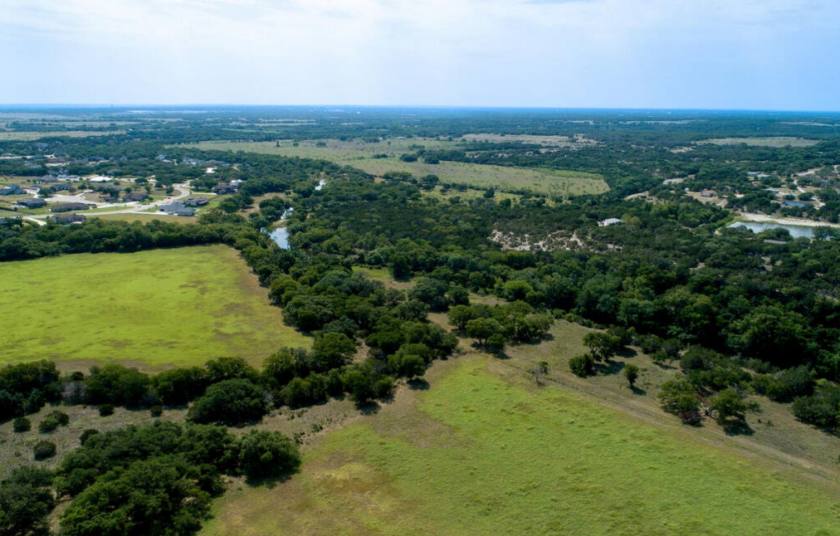
Commercial Land
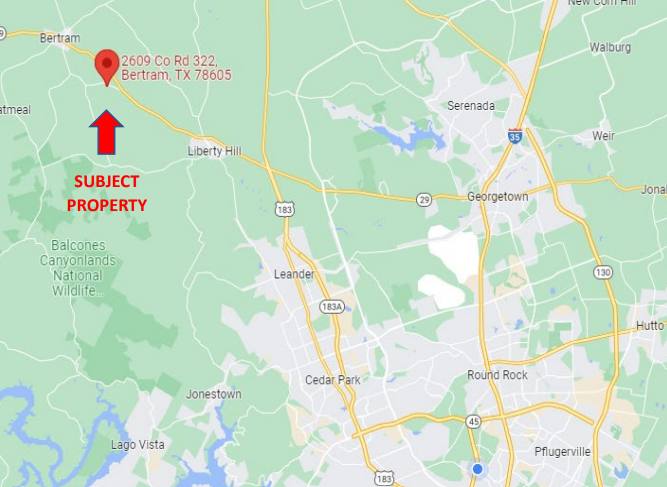
2609 County Road 322 Bertram, TX 78605
2609 County Road 322 Bertram, TX 78605
Details & Description
Property Highlights
- • Potential Uses: Residential development, Ranch
- • Zoning: No Zoning
- • Utilities: Septic & Well
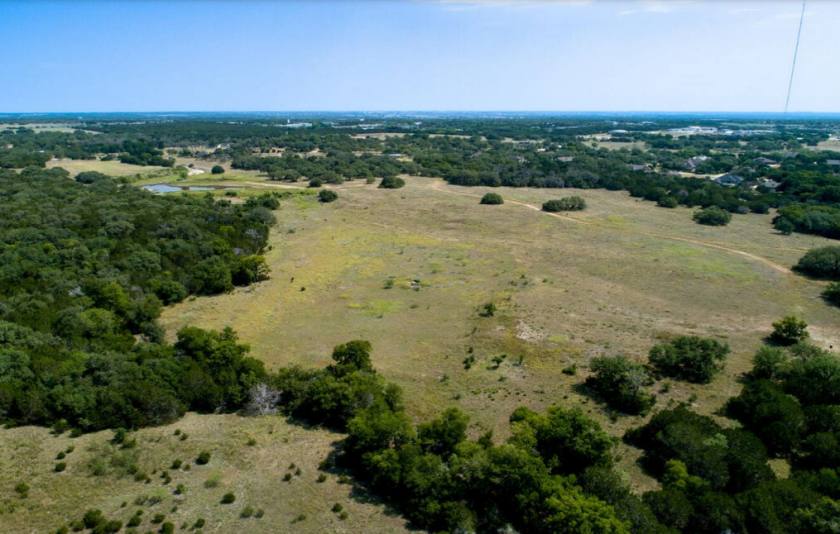
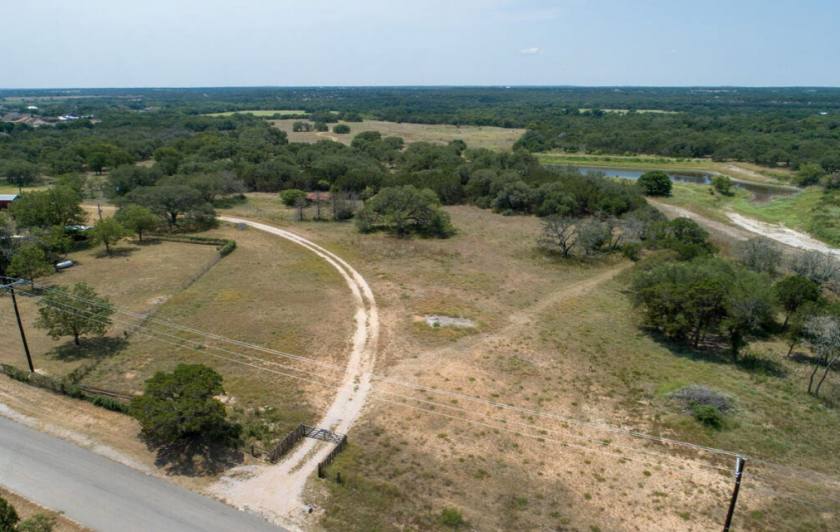
Additional Photos

Listing Agents

Wes Walters
O: 512-345-2060
weswalters@weswaltersrealty.com
O: 512-345-2060
weswalters@weswaltersrealty.com
While we strive to provide the most accurate information, all listing information, and demographic data, is provided by third-parties. As such, MyEListing will not be responsible for the accuracy of the information. It is strongly recommended that you verify all information with the listing agent, and any relevant agencies, prior to making any decisions.