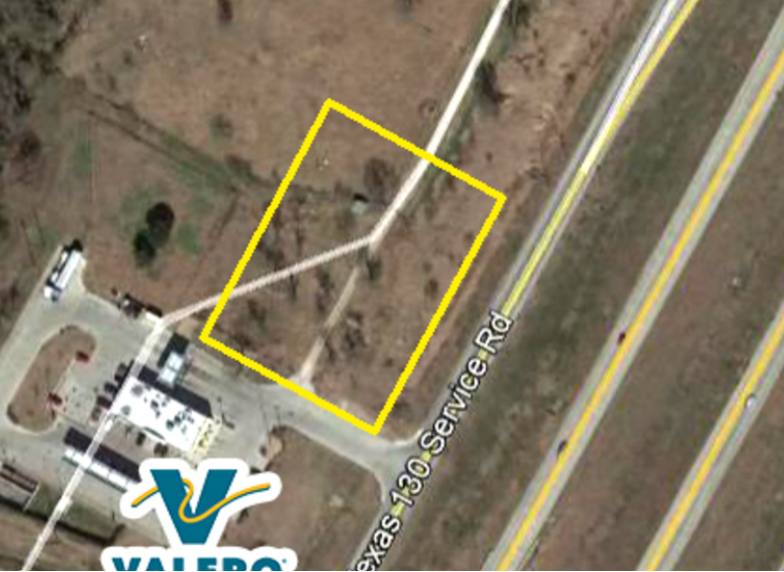
1-Mile | 3-Miles | 5-Miles | ||
---|---|---|---|---|
Total Population | 1,574 | 14,247 | 48,755 | |
Population Median Age | 36 | 33 | 33 | |
Population by Age | 0-9 Yrs | 209 (13%) | 2167 (15%) | 7421 (15%) |
10-19 Yrs | 227 (14%) | 2369 (16%) | 7280 (14%) | |
20-29 Yrs | 183 (11%) | 1794 (12%) | 7636 (15%) | |
30-39 Yrs | 240 (15%) | 2591 (18%) | 9745 (19%) | |
40-49 Yrs | 274 (17%) | 2191 (15%) | 6527 (13%) | |
50-59 Yrs | 170 (10%) | 1383 (9%) | 4878 (10%) | |
60-69 Yrs | 206 (13%) | 1289 (9%) | 3221 (6%) | |
70+ Yrs | 64 (4%) | 463 (3%) | 2048 (4%) | |
Median HH Income | $82,621 | $74,752 | $59,600 | |
Total Household Income | < 24K | 87 (17%) | 534 (12%) | 2352 (16%) |
25-49K | 66 (13%) | 753 (18%) | 3493 (24%) | |
50-74K | 74 (14%) | 776 (18%) | 3001 (21%) | |
75-99K | 89 (17%) | 716 (17%) | 2015 (14%) | |
100-199K | 184 (36%) | 1257 (30%) | 2865 (20%) | |
200K+ | 8 (1%) | 74 (1%) | 388 (2%) | |
Highest Education Level | No Diploma | 260 | 2414 | 8323 |
Diploma or GED | 257 | 2387 | 9446 | |
Some College | 242 | 1933 | 5595 | |
Assoc. Degree | 35 | 368 | 1164 | |
Bachelors Degree | 138 | 926 | 3948 | |
Higher Degree | 100 | 750 | 2315 | |
Total Housing Units | 550 | 4,323 | 14,944 | |
--Owner-Occupied | 385 | 3,113 | 9,364 | |
--Renter-Occupied | 122 | 996 | 4,750 | |
Owner-Occupied Values | < 100K | 53 | 766 | 2292 |
100-199K | 191 | 1210 | 2808 | |
200-299K | 108 | 824 | 2464 | |
300-399K | 33 | 224 | 1111 | |
400-499K | 0 | 36 | 444 | |
500K+ | 0 | 52 | 245 | |
Total Working Age Population | 1,234 | 10,675 | 36,649 | |
In Work Force | 928 | 7,523 | 23,802 | |
Not In Work Force | 306 | 3,152 | 12,847 | |
Workforce Employed | 905 | 7,237 | 22,300 | |
Workforce Unemployed | 20 | 269 | 1,468 | |
Civlian Workforce | 924 | 7,506 | 23,768 | |
Military Workforce | 3 | 17 | 34 | |
Total Households | 506 | 4,109 | 14,114 | |
Family Households | 378 | 3,145 | 10,075 | |
Non-Family Households | 128 | 965 | 4,039 | |
Married Couple | 274 | 2,257 | 6,243 | |
Other Family | 104 | 887 | 3,832 | |
Married w/Child | 131 | 1,171 | 3,397 | |
Single Male w/Child | 2 | 123 | 405 | |
Single Female w/Child | 39 | 374 | 1,726 |
Population Change Last Two Decades - Plus Projection
2000 | % | 2010 | % | 2020 | % | 2030 | |
---|---|---|---|---|---|---|---|
Texas | 20,851,820 | +21 | 25,145,561 | +18 | 29,677,668 | +18 | 34,894,452 |
Travis County | 812,280 | +26 | 1,024,266 | +26 | 1,291,502 | +19 | 1,540,812 |
Total Working Age Population:
Total Households:
Total Working Age Population:
Total Households:
Total Working Age Population:
Total Households: