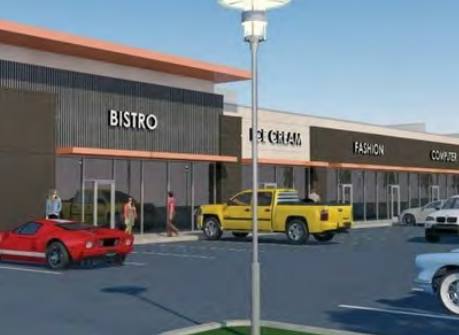
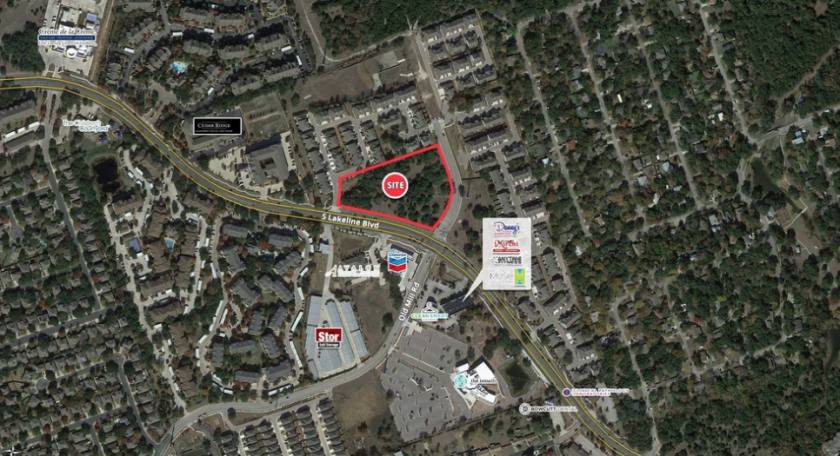
1-Mile | 3-Miles | 5-Miles | ||
---|---|---|---|---|
Total Population | 11,310 | 88,341 | 191,790 | |
Population Median Age | 39 | 36 | 36 | |
Population by Age | 0-9 Yrs | 1009 (8%) | 10877 (12%) | 25509 (13%) |
10-19 Yrs | 1322 (11%) | 13064 (14%) | 28256 (14%) | |
20-29 Yrs | 1785 (15%) | 11068 (12%) | 22742 (11%) | |
30-39 Yrs | 1812 (16%) | 15876 (17%) | 32620 (17%) | |
40-49 Yrs | 1786 (15%) | 14058 (15%) | 32189 (16%) | |
50-59 Yrs | 1557 (13%) | 10740 (12%) | 23031 (12%) | |
60-69 Yrs | 833 (7%) | 6510 (7%) | 14569 (7%) | |
70+ Yrs | 1206 (10%) | 6148 (6%) | 12874 (6%) | |
Median HH Income | $86,461 | $101,212 | $103,184 | |
Total Household Income | < 24K | 388 (8%) | 2757 (8%) | 5159 (7%) |
25-49K | 645 (14%) | 4756 (15%) | 9665 (14%) | |
50-74K | 866 (19%) | 4358 (13%) | 10101 (14%) | |
75-99K | 667 (15%) | 3583 (11%) | 7717 (11%) | |
100-199K | 1470 (33%) | 11714 (37%) | 24978 (37%) | |
200K+ | 373 (8%) | 4106 (13%) | 9772 (14%) | |
Highest Education Level | No Diploma | 283 | 2736 | 5213 |
Diploma or GED | 1535 | 8469 | 17764 | |
Some College | 1892 | 12981 | 27121 | |
Assoc. Degree | 523 | 4842 | 9820 | |
Bachelors Degree | 2915 | 21311 | 45252 | |
Higher Degree | 1131 | 9802 | 24273 | |
Total Housing Units | 4,805 | 33,073 | 71,429 | |
--Owner-Occupied | 2,187 | 19,391 | 41,957 | |
--Renter-Occupied | 2,221 | 11,884 | 25,434 | |
Owner-Occupied Values | < 100K | 0 | 334 | 669 |
100-199K | 249 | 1709 | 3452 | |
200-299K | 889 | 6153 | 12014 | |
300-399K | 682 | 5946 | 11068 | |
400-499K | 294 | 3009 | 7342 | |
500K+ | 73 | 2240 | 7413 | |
Total Working Age Population | 9,351 | 68,805 | 147,504 | |
In Work Force | 6,546 | 50,653 | 106,803 | |
Not In Work Force | 2,805 | 18,151 | 40,701 | |
Workforce Employed | 6,142 | 47,895 | 101,946 | |
Workforce Unemployed | 403 | 2,736 | 4,779 | |
Civlian Workforce | 6,545 | 50,631 | 106,726 | |
Military Workforce | 0 | 22 | 77 | |
Total Households | 4,408 | 31,275 | 67,392 | |
Family Households | 2,567 | 20,990 | 46,692 | |
Non-Family Households | 1,841 | 10,285 | 20,700 | |
Married Couple | 1,904 | 16,842 | 38,316 | |
Other Family | 663 | 4,148 | 8,376 | |
Married w/Child | 852 | 8,835 | 20,582 | |
Single Male w/Child | 84 | 584 | 1,124 | |
Single Female w/Child | 227 | 1,779 | 3,787 |
Population Change Last Two Decades - Plus Projection
2000 | % | 2010 | % | 2020 | % | 2030 | |
---|---|---|---|---|---|---|---|
Texas | 20,851,820 | +21 | 25,145,561 | +18 | 29,677,668 | +18 | 34,894,452 |
Travis County | 812,280 | +26 | 1,024,266 | +26 | 1,291,502 | +19 | 1,540,812 |
Williamson County | 249,967 | +69 | 422,679 | +40 | 589,914 | +41 | 830,421 |
Total Working Age Population:
Total Households:
Total Working Age Population:
Total Households:
Total Working Age Population:
Total Households: