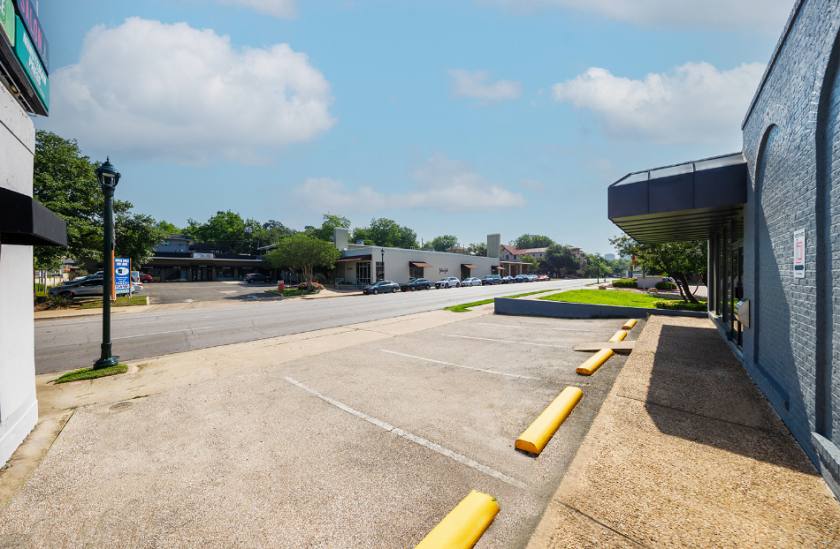
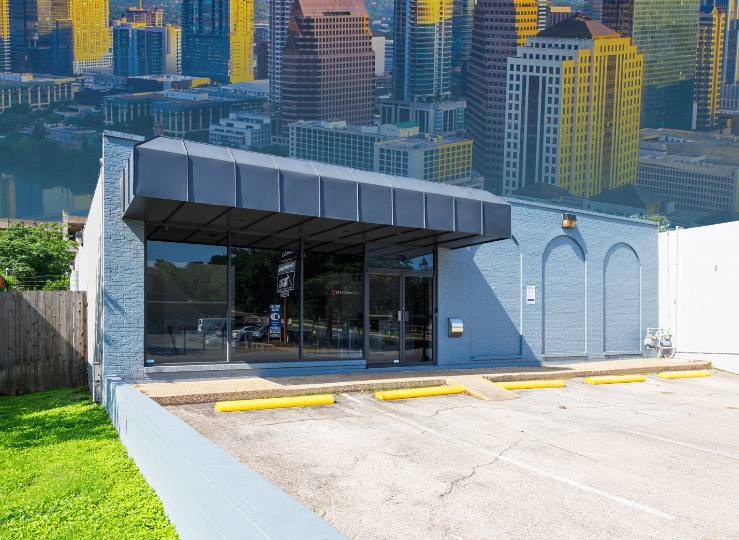
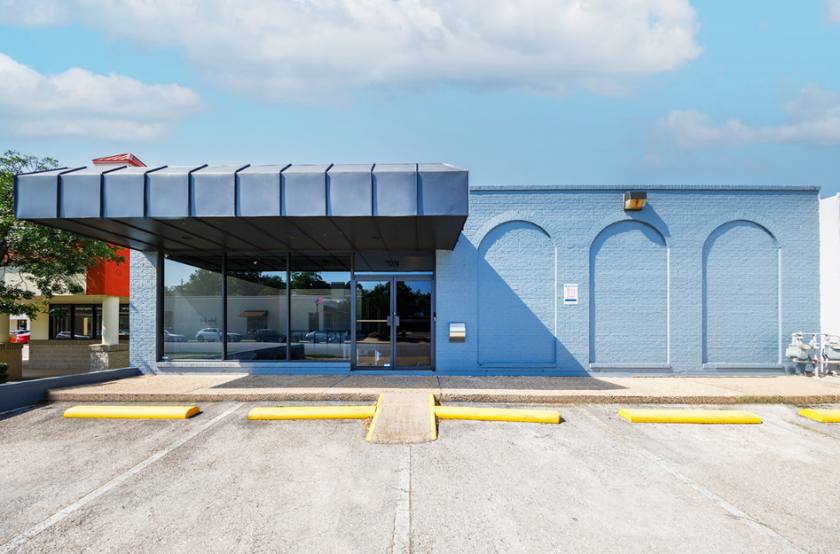
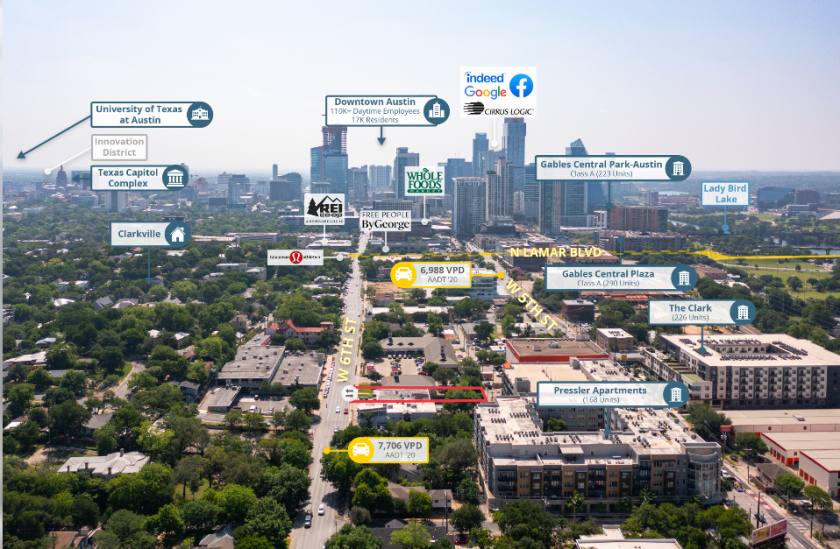
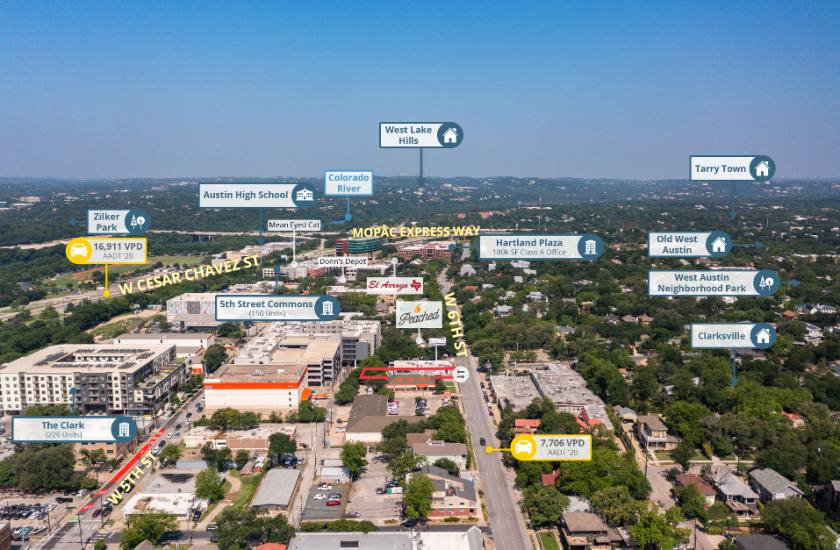
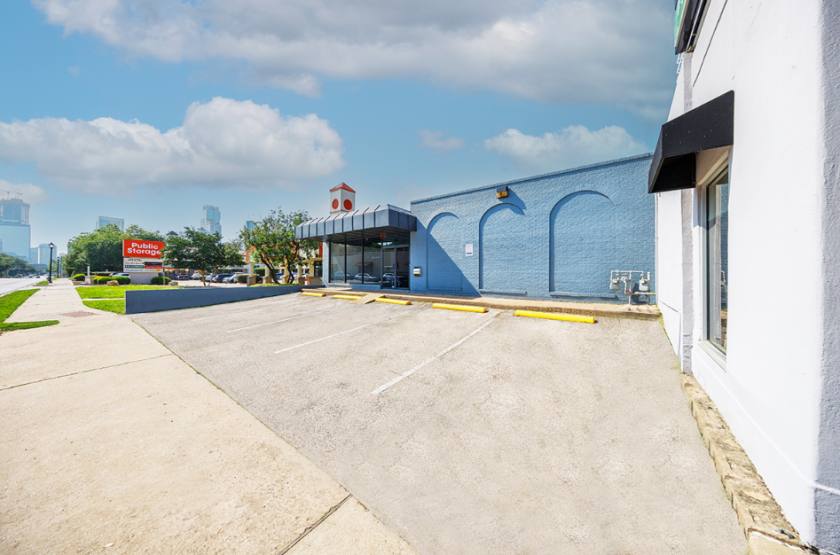
1-Mile | 3-Miles | 5-Miles | ||
---|---|---|---|---|
Total Population | 17,287 | 151,241 | 322,385 | |
Population Median Age | 39 | 34 | 35 | |
Population by Age | 0-9 Yrs | 881 (5%) | 9861 (6%) | 26095 (8%) |
10-19 Yrs | 480 (2%) | 19579 (12%) | 35694 (11%) | |
20-29 Yrs | 4145 (23%) | 43563 (28%) | 84444 (26%) | |
30-39 Yrs | 4722 (27%) | 28615 (18%) | 63489 (19%) | |
40-49 Yrs | 3076 (17%) | 18285 (12%) | 40544 (12%) | |
50-59 Yrs | 1689 (9%) | 12621 (8%) | 29488 (9%) | |
60-69 Yrs | 1264 (7%) | 10933 (7%) | 24415 (7%) | |
70+ Yrs | 1031 (5%) | 7784 (5%) | 18216 (5%) | |
Median HH Income | $112,014 | $83,947 | $74,773 | |
Total Household Income | < 24K | 1035 (10%) | 12067 (18%) | 25356 (17%) |
25-49K | 1201 (11%) | 9524 (14%) | 24315 (17%) | |
50-74K | 1239 (12%) | 8954 (13%) | 20953 (14%) | |
75-99K | 1090 (10%) | 7602 (11%) | 15811 (11%) | |
100-199K | 3555 (34%) | 16836 (25%) | 34961 (24%) | |
200K+ | 2165 (21%) | 11549 (17%) | 19493 (13%) | |
Highest Education Level | No Diploma | 213 | 5199 | 17085 |
Diploma or GED | 764 | 7996 | 25175 | |
Some College | 1274 | 11848 | 32065 | |
Assoc. Degree | 233 | 3651 | 9121 | |
Bachelors Degree | 7172 | 42011 | 84927 | |
Higher Degree | 5009 | 28683 | 54125 | |
Total Housing Units | 11,920 | 75,729 | 156,403 | |
--Owner-Occupied | 3,551 | 24,515 | 54,009 | |
--Renter-Occupied | 6,734 | 42,018 | 86,879 | |
Owner-Occupied Values | < 100K | 86 | 496 | 1401 |
100-199K | 56 | 650 | 2673 | |
200-299K | 61 | 1400 | 5941 | |
300-399K | 349 | 2824 | 8665 | |
400-499K | 635 | 3193 | 8214 | |
500K+ | 2366 | 15951 | 27116 | |
Total Working Age Population | 16,127 | 136,753 | 282,273 | |
In Work Force | 13,094 | 95,778 | 206,724 | |
Not In Work Force | 3,033 | 40,975 | 75,550 | |
Workforce Employed | 12,765 | 91,027 | 197,605 | |
Workforce Unemployed | 310 | 4,702 | 9,027 | |
Civlian Workforce | 13,075 | 95,730 | 206,632 | |
Military Workforce | 19 | 49 | 92 | |
Total Households | 10,285 | 66,533 | 140,888 | |
Family Households | 3,210 | 23,993 | 56,956 | |
Non-Family Households | 7,075 | 42,539 | 83,932 | |
Married Couple | 2,852 | 19,052 | 42,197 | |
Other Family | 358 | 4,941 | 14,760 | |
Married w/Child | 664 | 6,739 | 16,237 | |
Single Male w/Child | 33 | 408 | 1,534 | |
Single Female w/Child | 56 | 1,853 | 5,617 |
Population Change Last Two Decades - Plus Projection
2000 | % | 2010 | % | 2020 | % | 2030 | |
---|---|---|---|---|---|---|---|
Texas | 20,851,820 | +21 | 25,145,561 | +18 | 29,677,668 | +18 | 34,894,452 |
Travis County | 812,280 | +26 | 1,024,266 | +26 | 1,291,502 | +19 | 1,540,812 |
Total Working Age Population:
Total Households:
Total Working Age Population:
Total Households:
Total Working Age Population:
Total Households: