Flex-Office-Warehouse
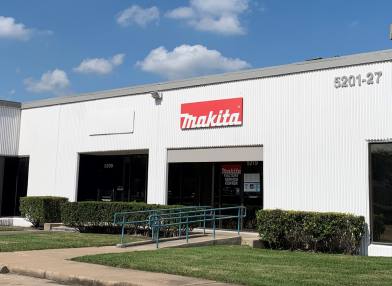
5201-5291 Langfield Road Houston, TX 77040
5201-5291 Langfield Road Houston, TX 77040
Details & Description
Property Highlights
- • Drive-in, grade level, dock well loading available
- • 12’ to 14’ clear height
- • 3 phase 480 v 225 amps
- • 40+ parking spots available
- • Space has 1 truck and 1 ramp
- • Both suites can be combined
Listing Agents

Jon Lindenberger
O: 713-830-2163
M: 713-252-4011
jon.lindenberger@colliers.com
O: 713-830-2163
M: 713-252-4011
jon.lindenberger@colliers.com
While we strive to provide the most accurate information, all listing information, and demographic data, is provided by third-parties. As such, MyEListing will not be responsible for the accuracy of the information. It is strongly recommended that you verify all information with the listing agent, and any relevant agencies, prior to making any decisions.


