Office Space
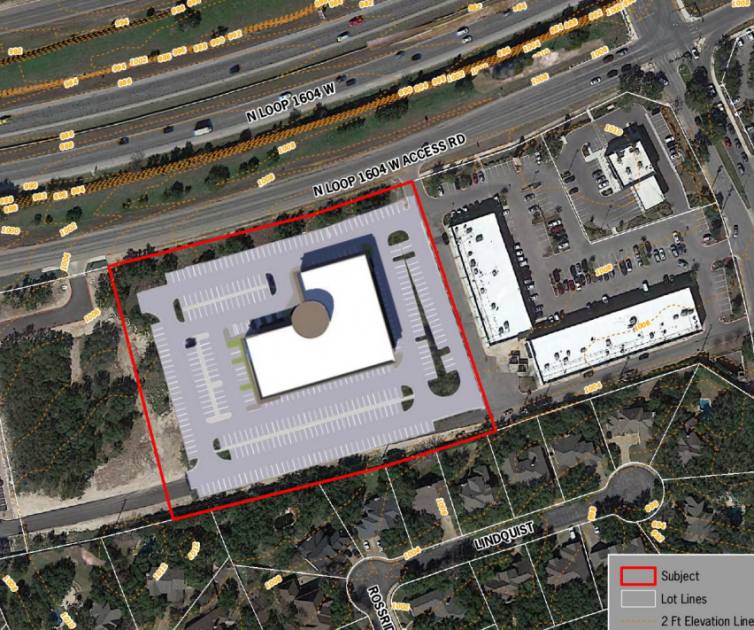
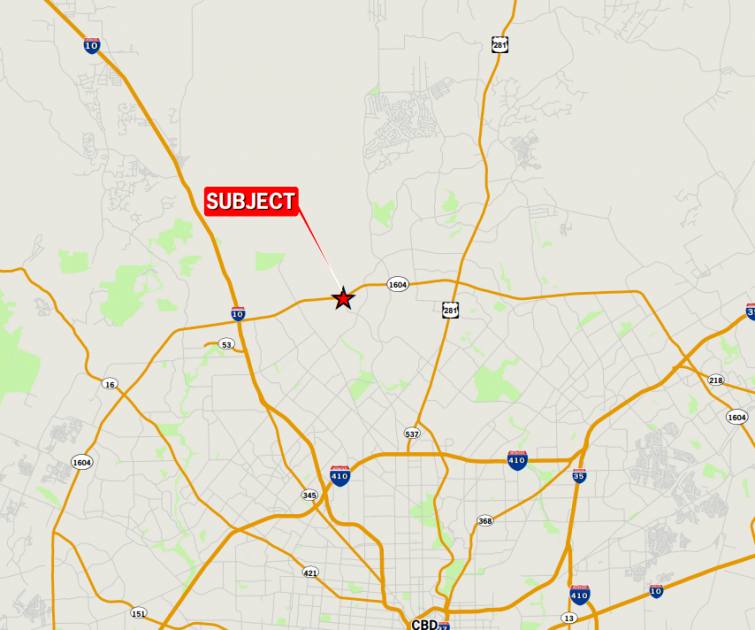
2718 North Loop 1604 West Access Road San Antonio, TX 78248
2718 North Loop 1604 West Access Road San Antonio, TX 78248

Details & Description
Property Highlights
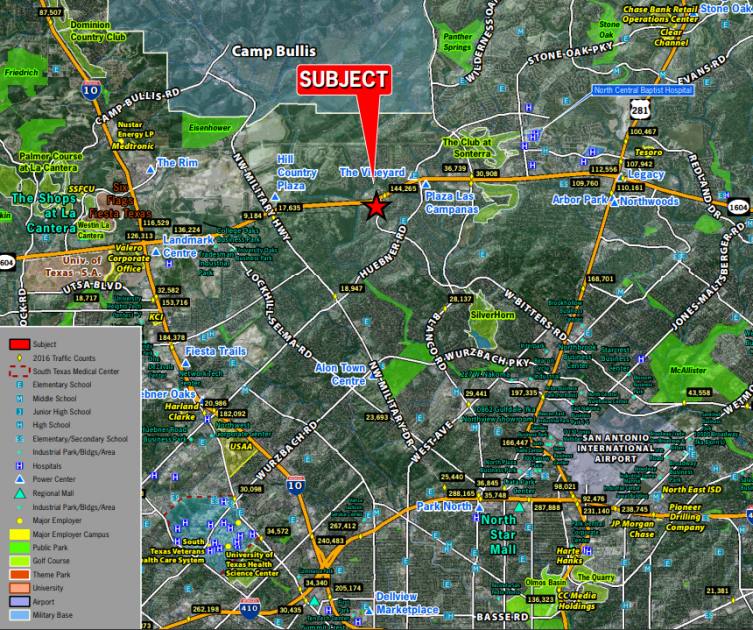
- • Minutes from San Antonio International Airport
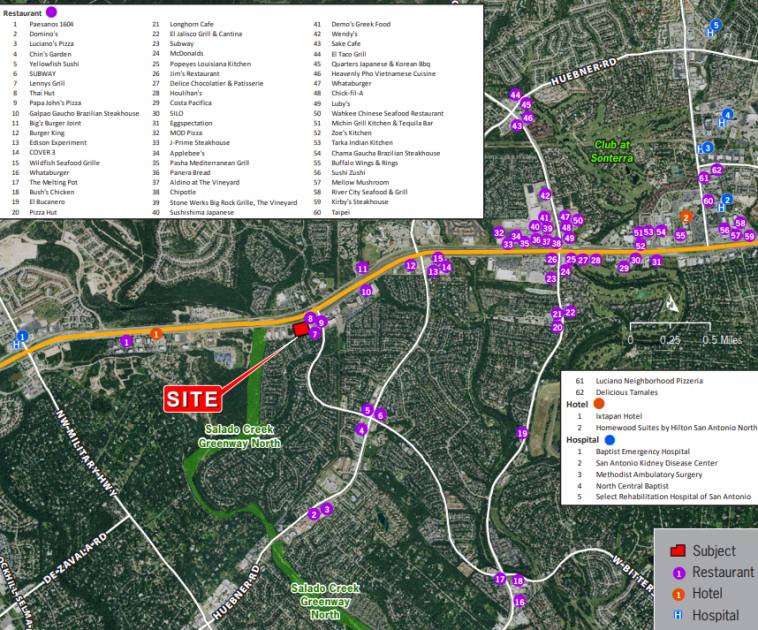
- • Numerous retailers and restaurants in area
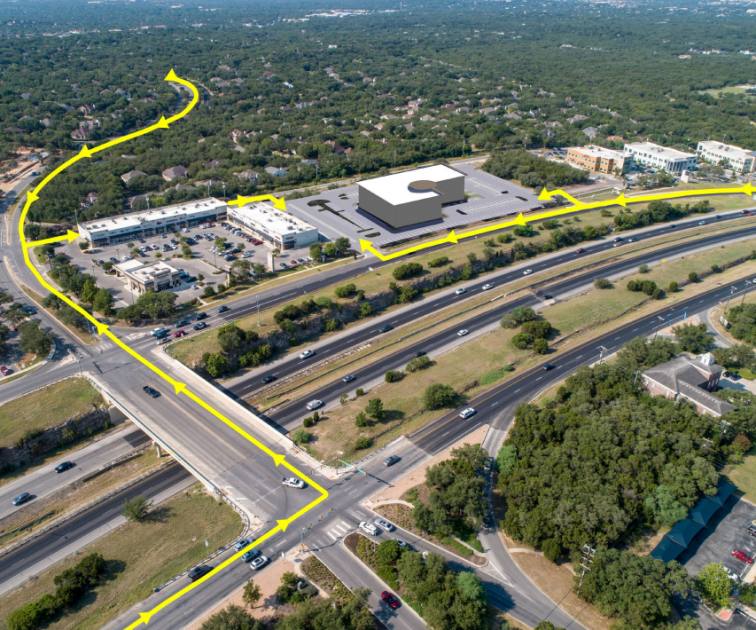
- • Monument signage available
- • Elevator lobby exposure
- • Covered parking available
- • Multiple ingress/egress possibilities
Additional Photos
Listing Agents

Todd Gold
O: 210-524-4000
M: 210-524-1309
tgold@reocsanantonio.com
O: 210-524-4000
M: 210-524-1309
tgold@reocsanantonio.com

Brian Harris
O: 210-524-4000
M: 210-524-1314
bharris@reocsanantonio.com
O: 210-524-4000
M: 210-524-1314
bharris@reocsanantonio.com

Kimberly Gatley
O: 210-524-4000
M: 210-524-1320
kgatley@reocsanantonio.com
O: 210-524-4000
M: 210-524-1320
kgatley@reocsanantonio.com
While we strive to provide the most accurate information, all listing information, and demographic data, is provided by third-parties. As such, MyEListing will not be responsible for the accuracy of the information. It is strongly recommended that you verify all information with the listing agent, and any relevant agencies, prior to making any decisions.