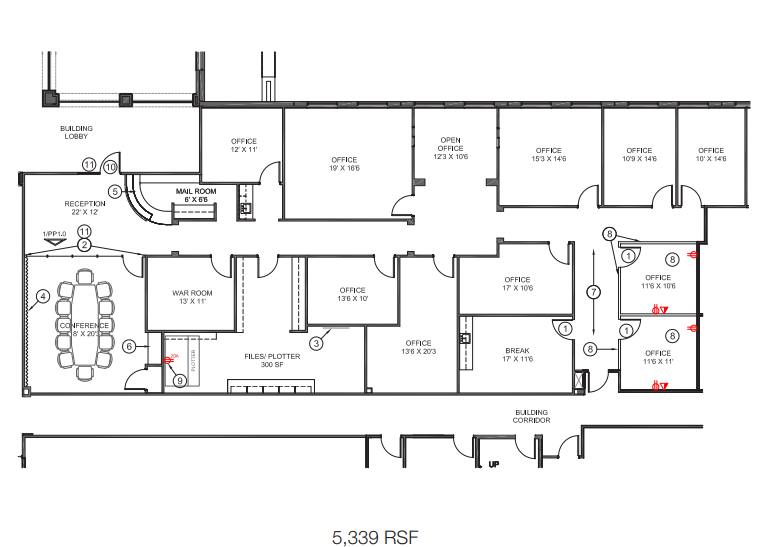
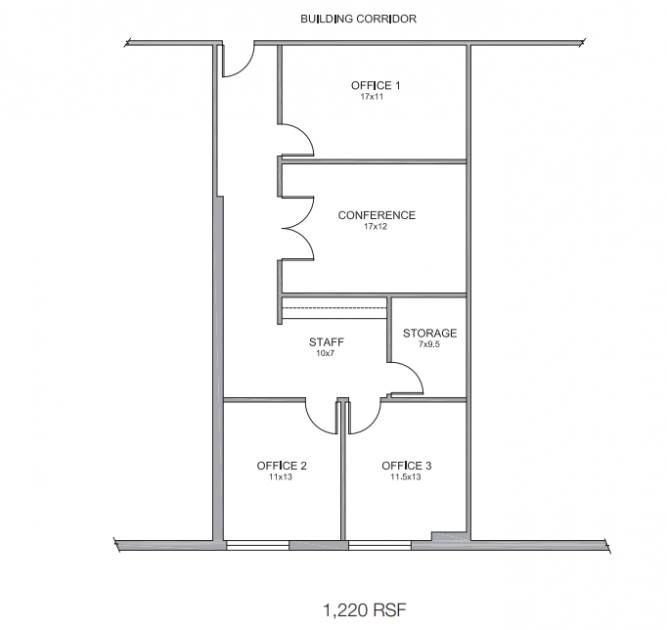
Office Space
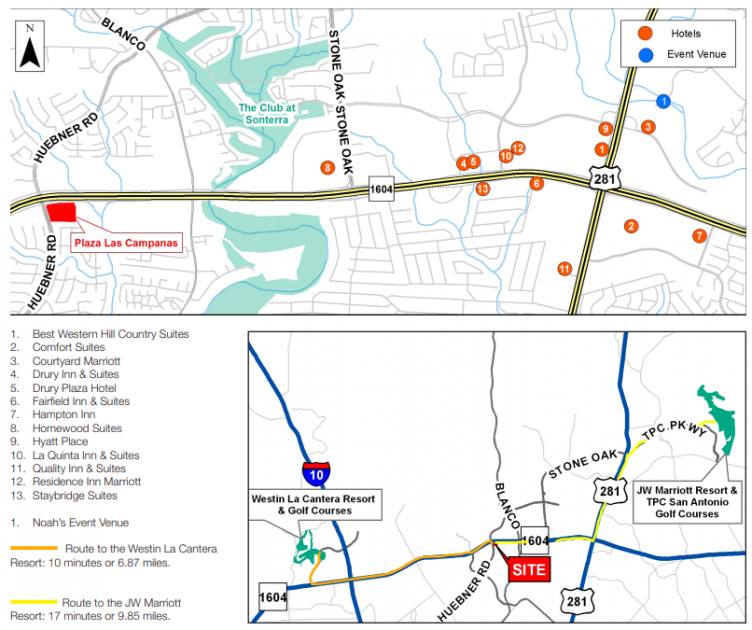
1826 North Loop 1604 West Access Road San Antonio, TX 78248
1826 North Loop 1604 West Access Road San Antonio, TX 78248

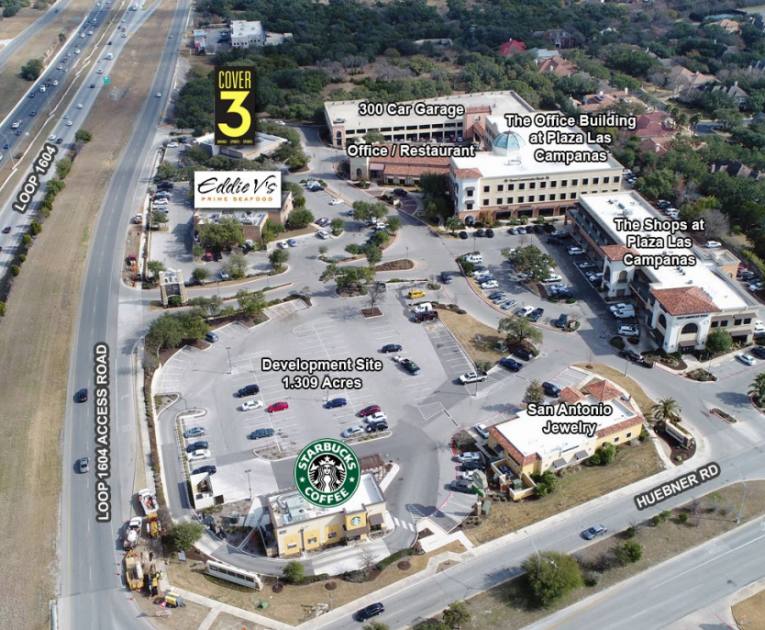
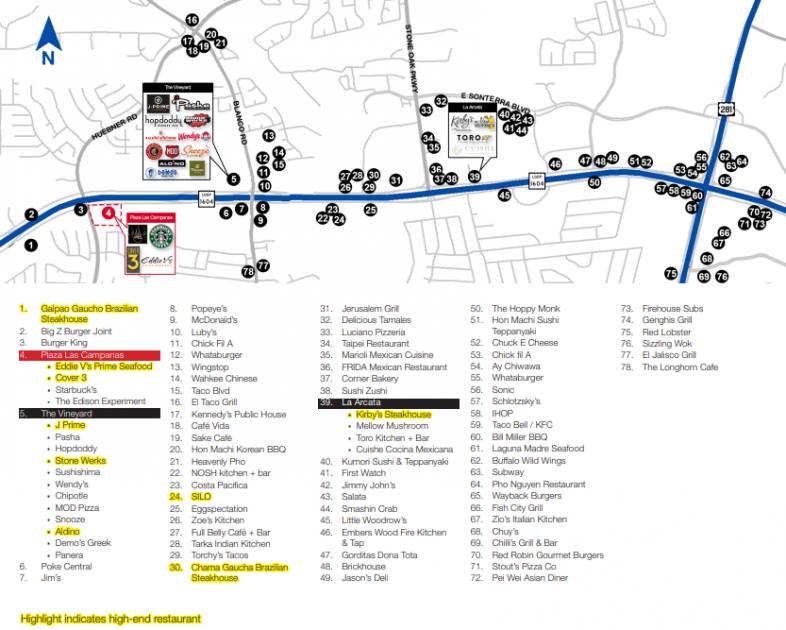
Details & Description
Property Highlights
- • Attractive exterior design
- • Valet drop-off
- • Fountain/plaza adjacent to the office building
- • Prestigious client base & unique tenant mix
- • Exceptional demographic profile
Additional Photos

Listing Agents

Brian Harris
O: 210-524-4000
M: 210-524-1314
bharris@reocsanantonio.com
O: 210-524-4000
M: 210-524-1314
bharris@reocsanantonio.com

Kimberly Gatley
O: 210-524-4000
M: 210-524-1320
kgatley@reocsanantonio.com
O: 210-524-4000
M: 210-524-1320
kgatley@reocsanantonio.com
While we strive to provide the most accurate information, all listing information, and demographic data, is provided by third-parties. As such, MyEListing will not be responsible for the accuracy of the information. It is strongly recommended that you verify all information with the listing agent, and any relevant agencies, prior to making any decisions.