Commercial Land
Interstate 20 and FM Hwy 314 Van, TX 75790
Interstate 20 and FM Hwy 314 Van, TX 75790
Details & Description
Property Highlights
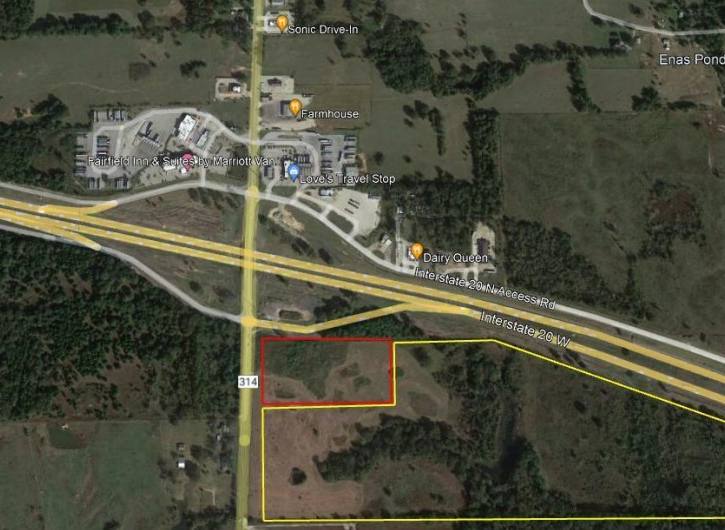
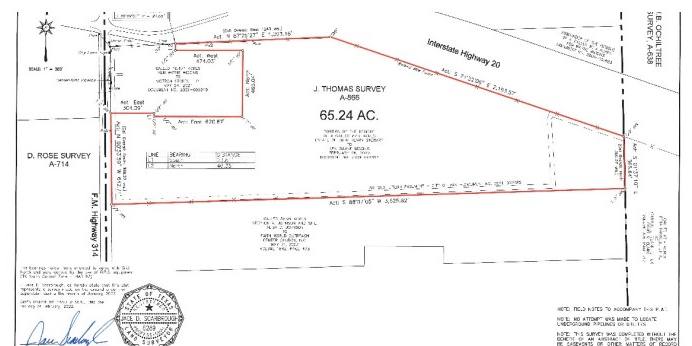
- • Frontage on Interstate 20 & FM Hwy 314
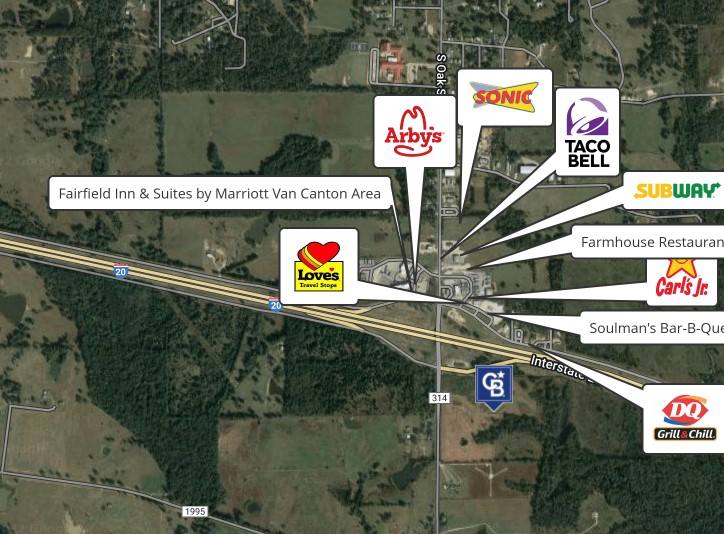
- • Ideal visibility and accessibility
- • Municipal served water and sewer
- • Can be subdivided
- • Possible pad sites on FM Hwy 314
- • Adjacent to new retail development
Additional Photos


Listing Agents

Greg Cagle
O: 817-308-2592
greg.cagle@cbdfw.com
O: 817-308-2592
greg.cagle@cbdfw.com
While we strive to provide the most accurate information, all listing information, and demographic data, is provided by third-parties. As such, MyEListing will not be responsible for the accuracy of the information. It is strongly recommended that you verify all information with the listing agent, and any relevant agencies, prior to making any decisions.


