Specialty Real Estate
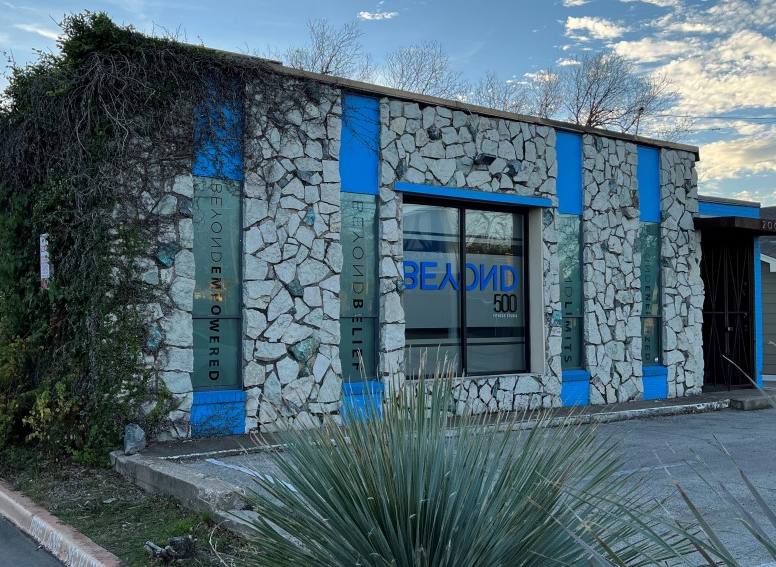
2003 North Henderson Avenue Dallas, TX 75206
2003 North Henderson Avenue Dallas, TX 75206
Details & Description
Property Highlights
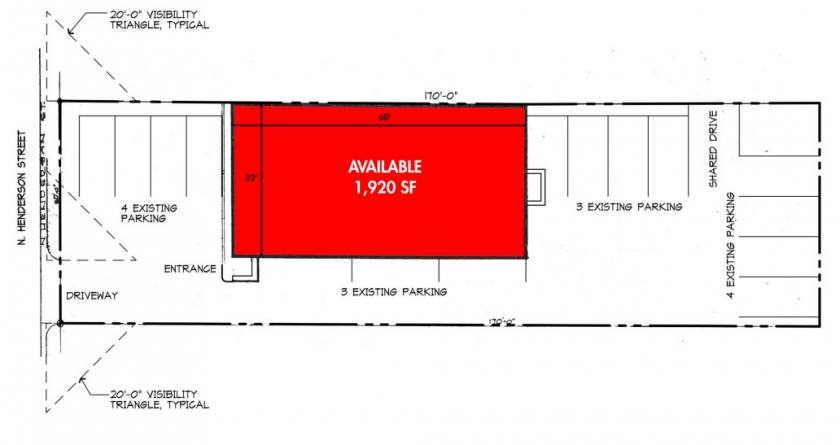
- • Exclusive parking
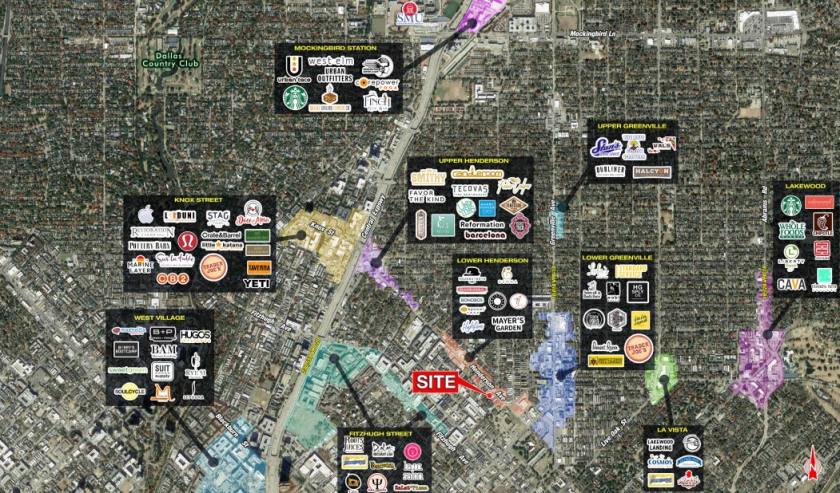
- • Traffic Counts: Henderson Ave.: 6,550 VPD-19
- • Traffic Counts: Greenville Ave.: 10,016 VPD-19
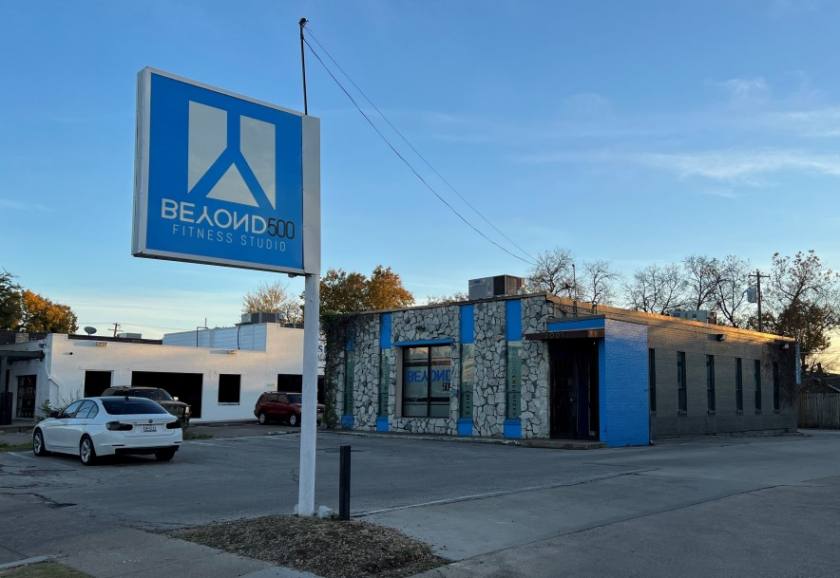
Additional Photos

Listing Agents

Thomas Glendenning
O: 214-960-4528
M: 214-960-4545
thomas@shopcompanies.com
O: 214-960-4528
M: 214-960-4545
thomas@shopcompanies.com

Jake Sherrington
O: 214-960-4545
M: 214-960-4623
jake@shopcompanies.com
O: 214-960-4545
M: 214-960-4623
jake@shopcompanies.com
While we strive to provide the most accurate information, all listing information, and demographic data, is provided by third-parties. As such, MyEListing will not be responsible for the accuracy of the information. It is strongly recommended that you verify all information with the listing agent, and any relevant agencies, prior to making any decisions.


