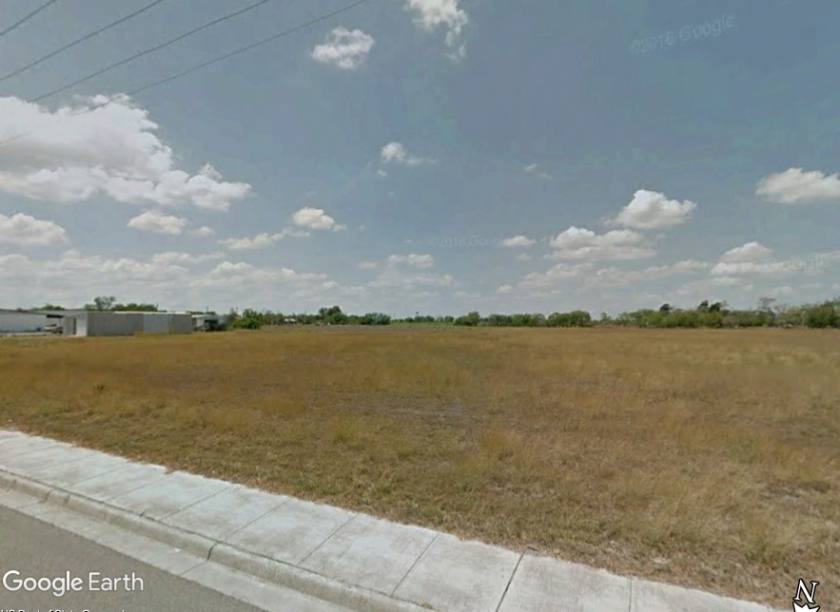
Commercial Land
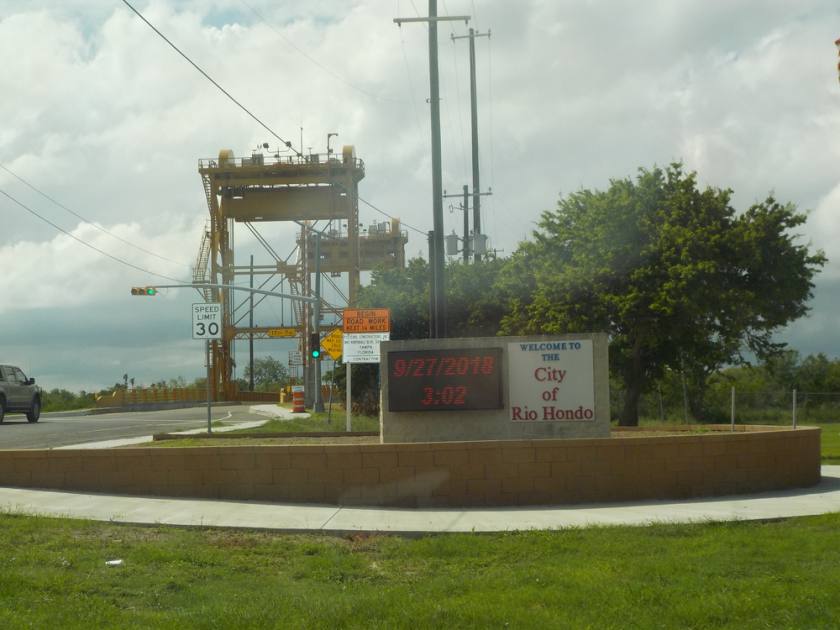
28202 Farm to Market Road 106 Rio Hondo, TX 78583
28202 Farm to Market Road 106 Rio Hondo, TX 78583
Details & Description
Property Highlights
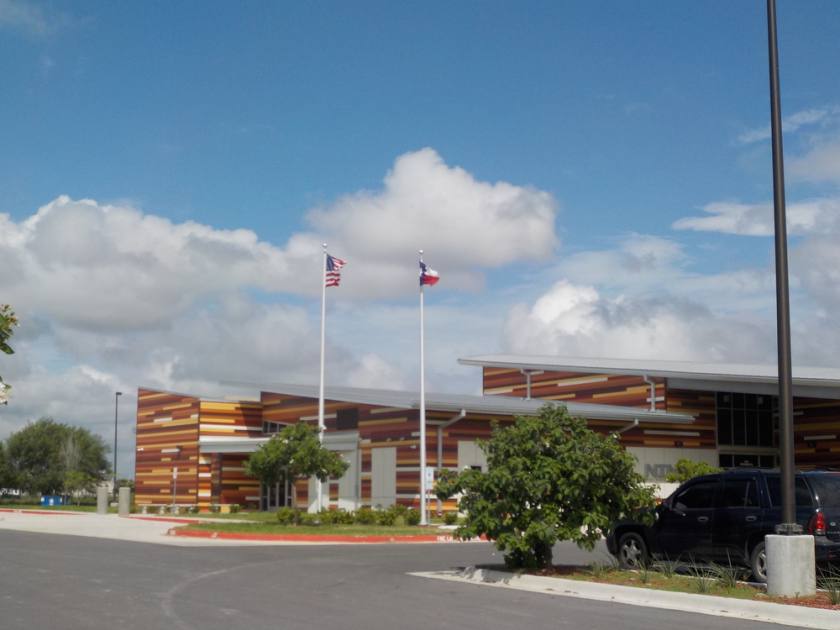
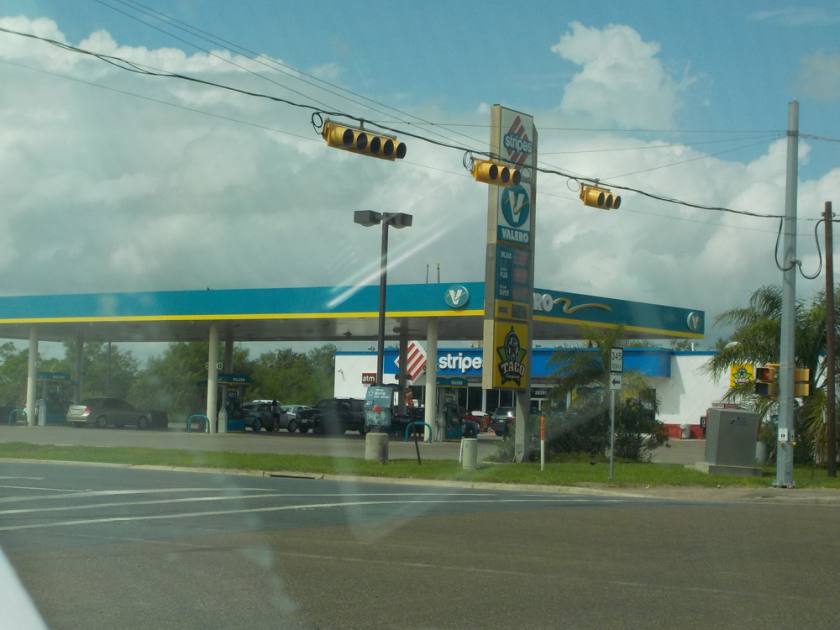
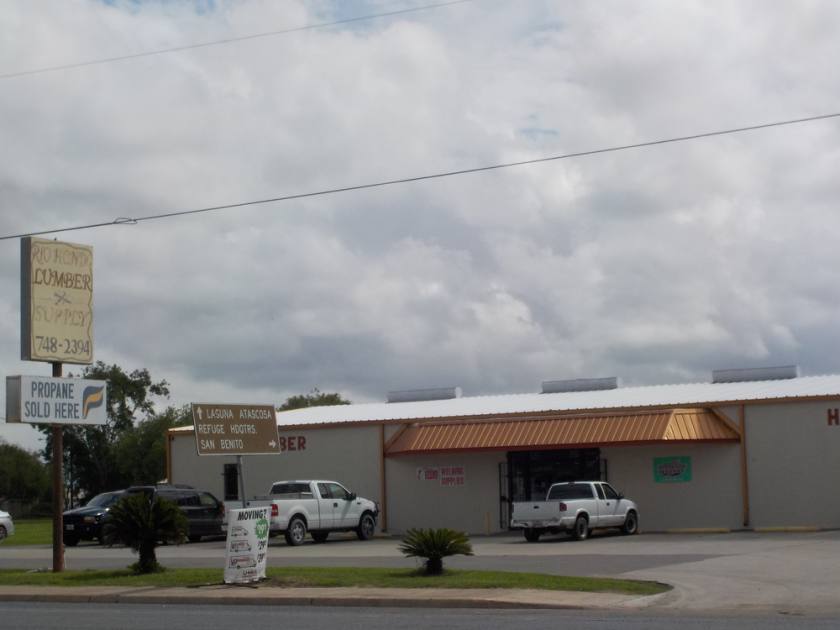
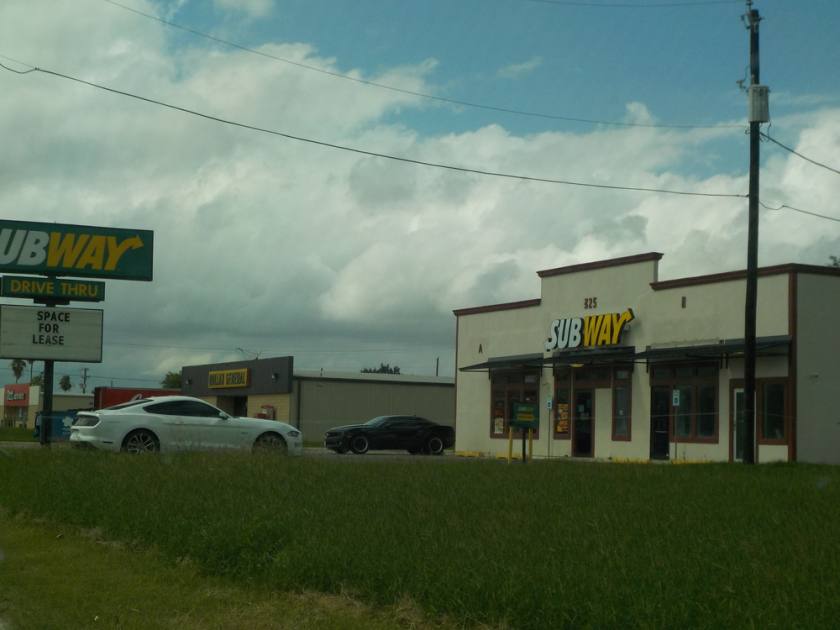
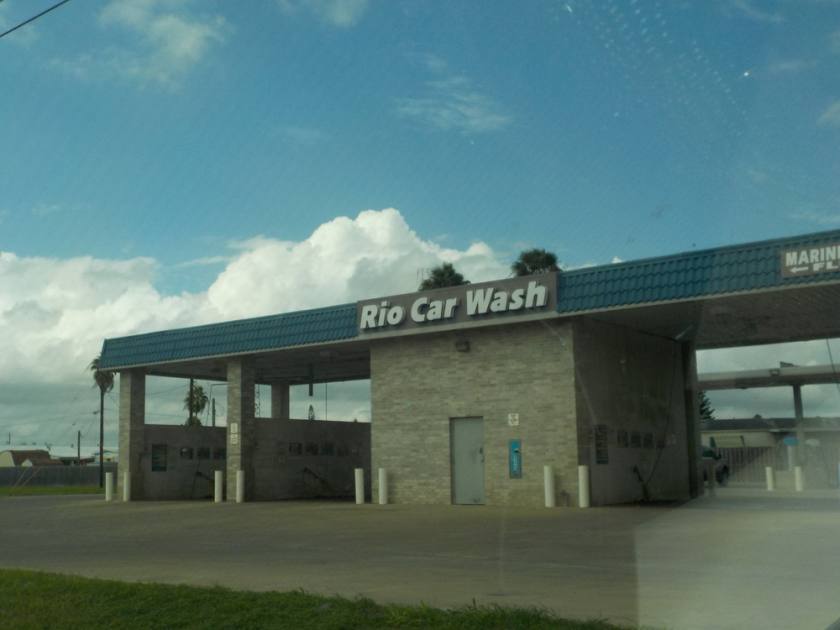
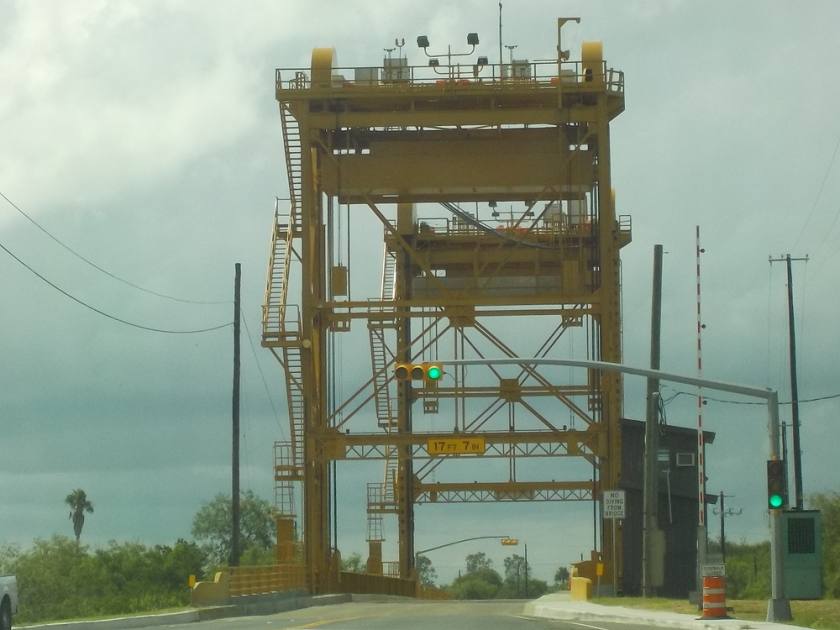
• Fronting Main Thoroughfare
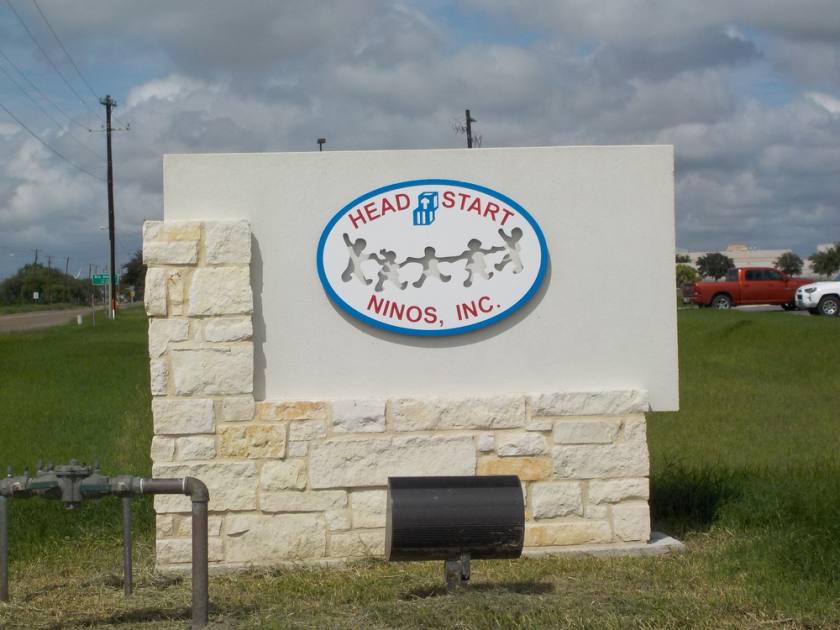
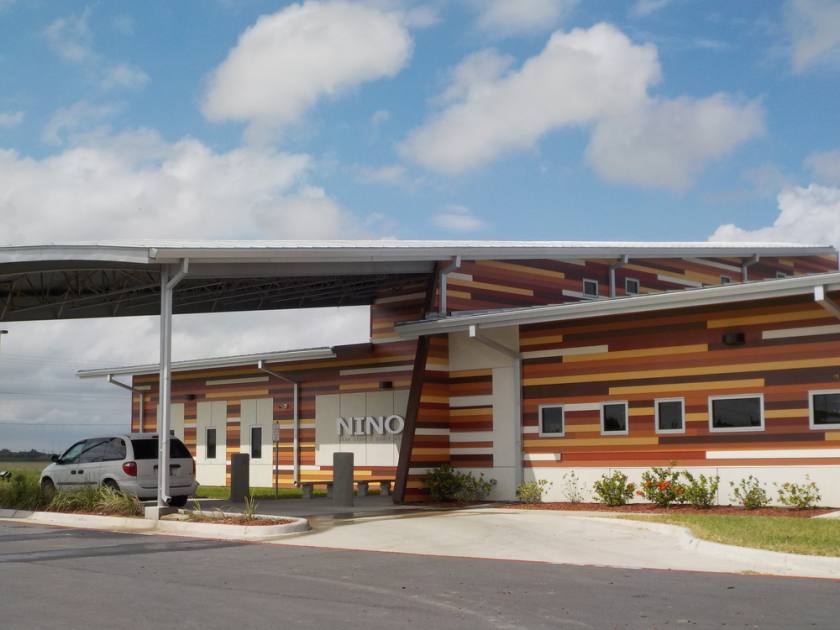
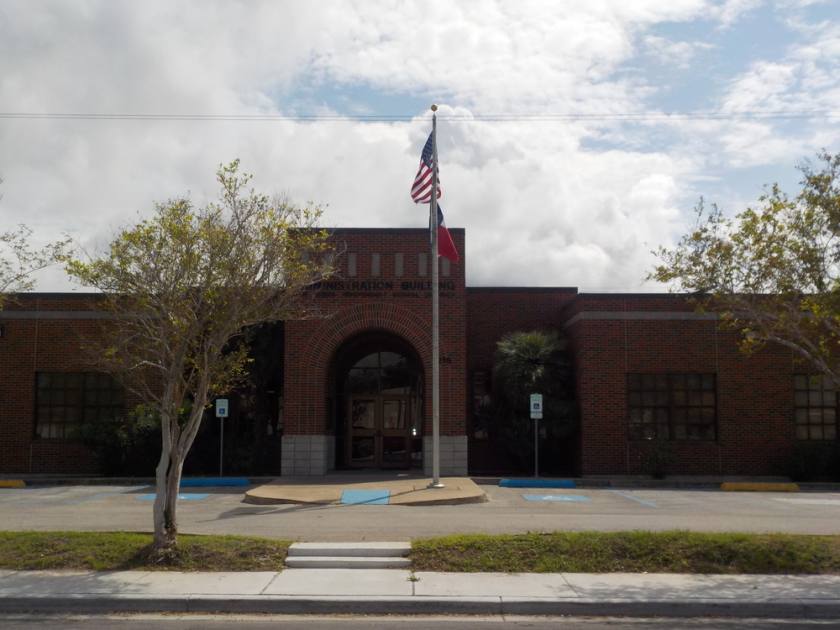
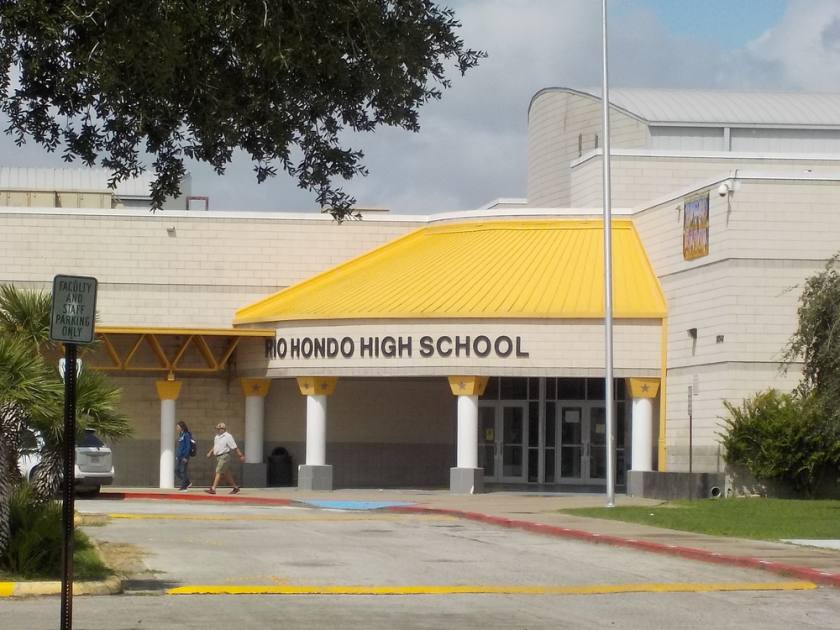
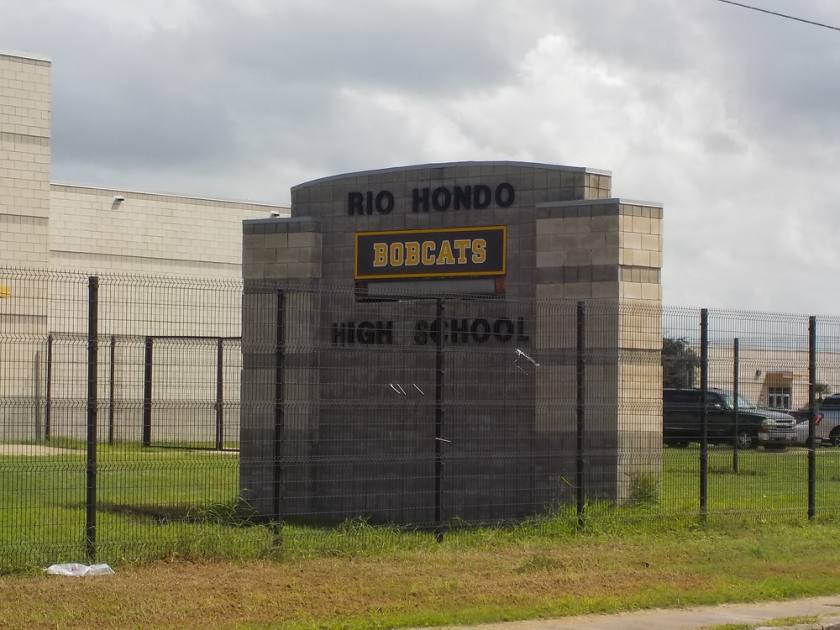
• Proximity to Schools
Additional Photos


Listing Agents

Cindy Hopkins
O: 956-778-3255
M: 956-778-3255
chopkins@ccim.net
O: 956-778-3255
M: 956-778-3255
chopkins@ccim.net
While we strive to provide the most accurate information, all listing information, and demographic data, is provided by third-parties. As such, MyEListing will not be responsible for the accuracy of the information. It is strongly recommended that you verify all information with the listing agent, and any relevant agencies, prior to making any decisions.