Office Space
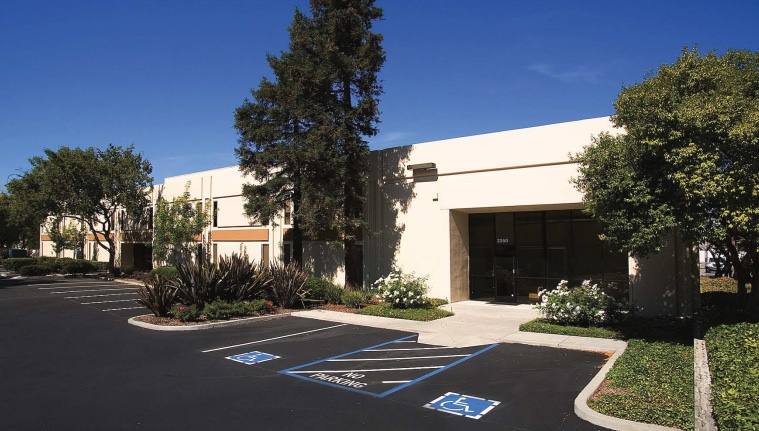
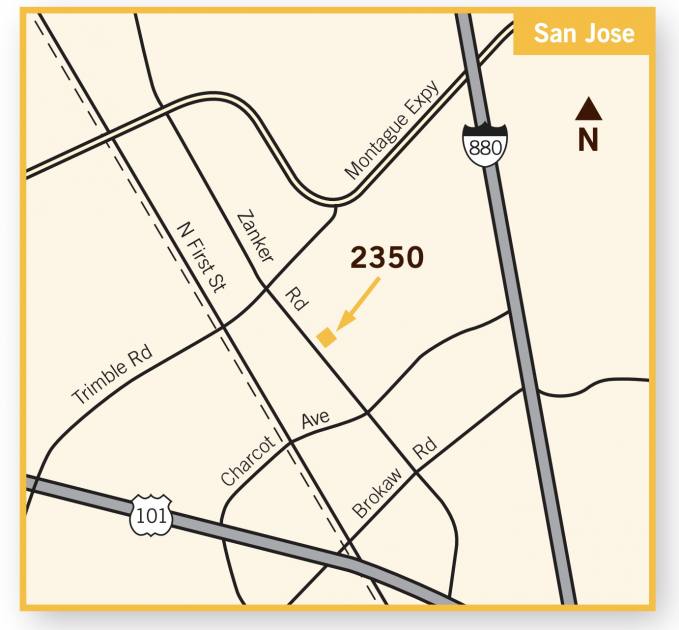
2350 Zanker Road San Jose, CA 95131
2350 Zanker Road San Jose, CA 95131
Details & Description
Property Highlights
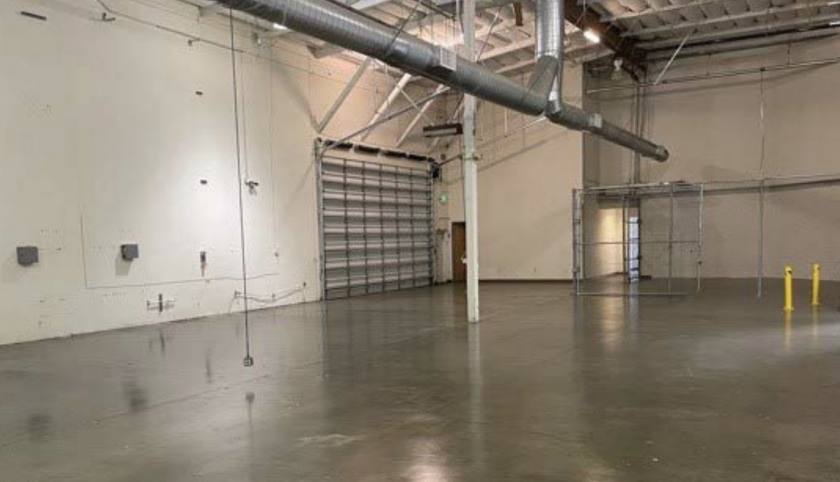
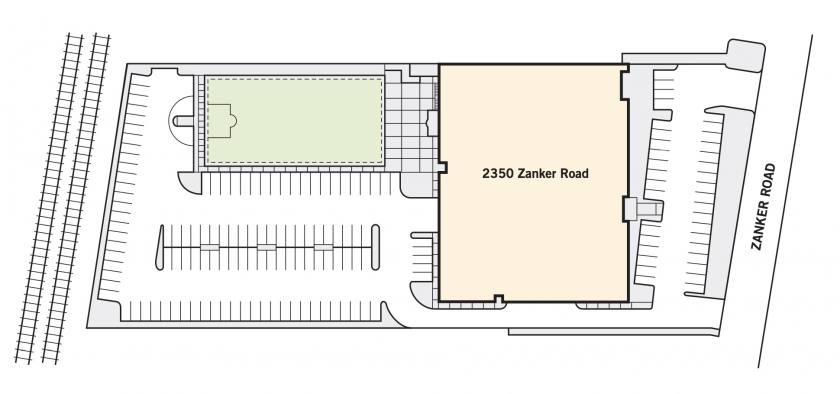
- • Freestanding building on 3.05-acre site
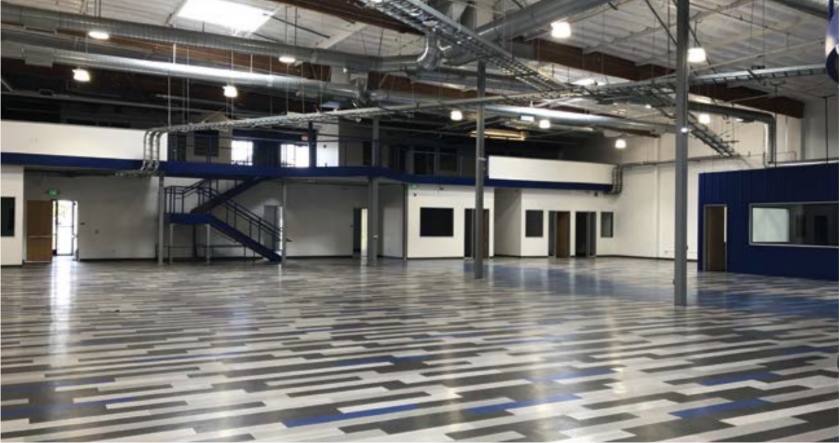
- • 24' maximum clear height
- • Double-wide grade level loading door
- • Utility pad
- • 3/1000 parking
- • Employee recreation field
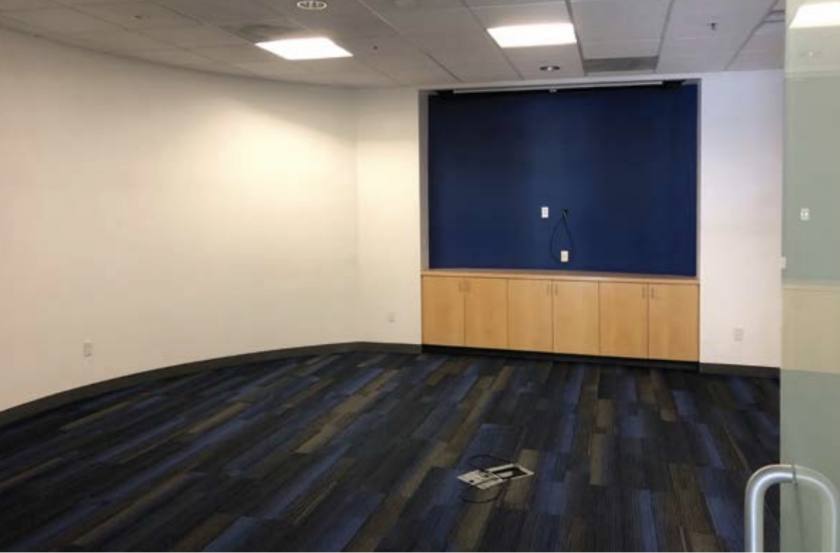
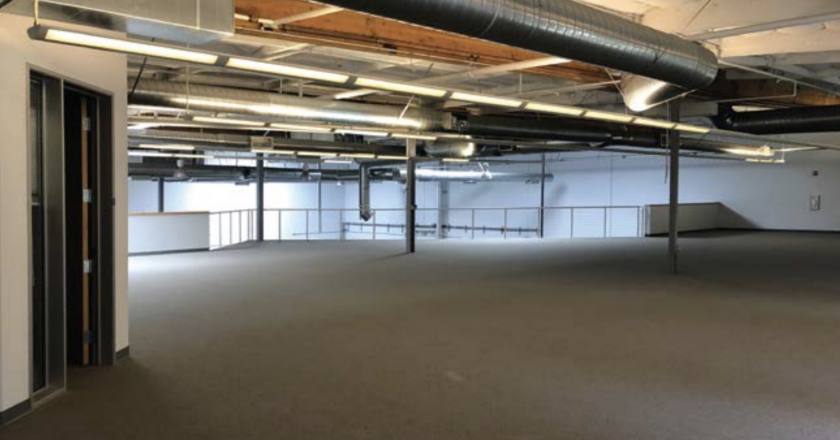
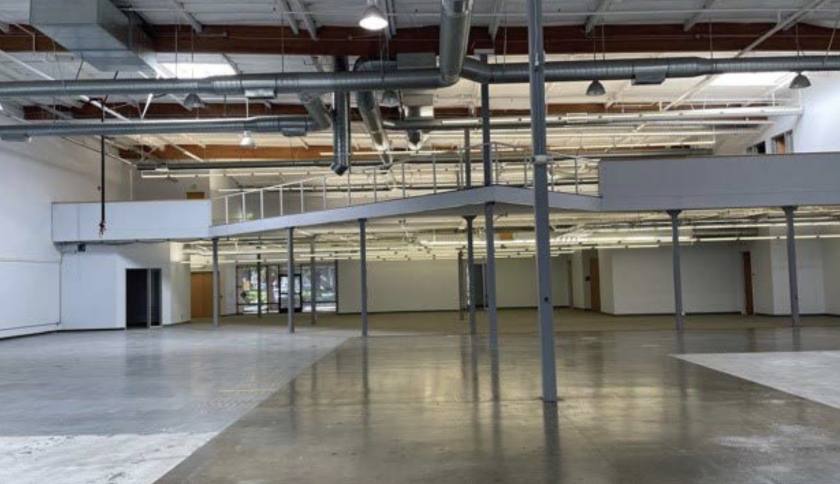
Additional Photos
Listing Agents

David Conklin
Renault & Handley
O: 650-321-3040
M: 650-461-2202
dconklin@renault-handley.com
Renault & Handley
O: 650-321-3040
M: 650-461-2202
dconklin@renault-handley.com

Geordie Mckee
Renault & Handley
O: 650-321-3040
M: 650-461-2208
gmckee@renault-handley.com
Renault & Handley
O: 650-321-3040
M: 650-461-2208
gmckee@renault-handley.com
While we strive to provide the most accurate information, all listing information, and demographic data, is provided by third-parties. As such, MyEListing will not be responsible for the accuracy of the information. It is strongly recommended that you verify all information with the listing agent, and any relevant agencies, prior to making any decisions.