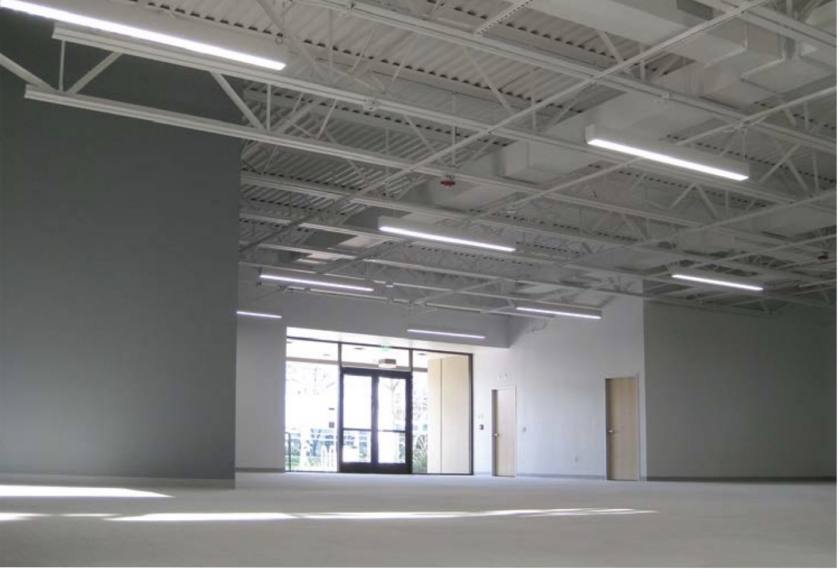
Office Space
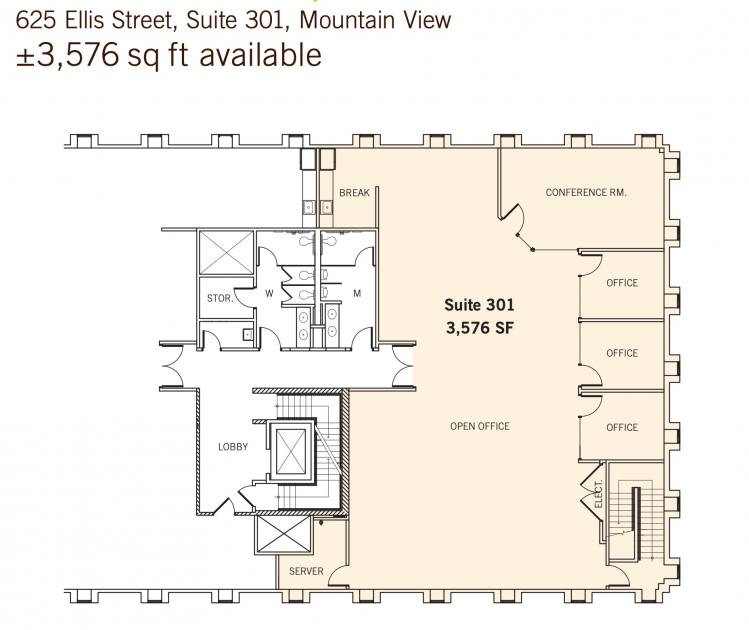
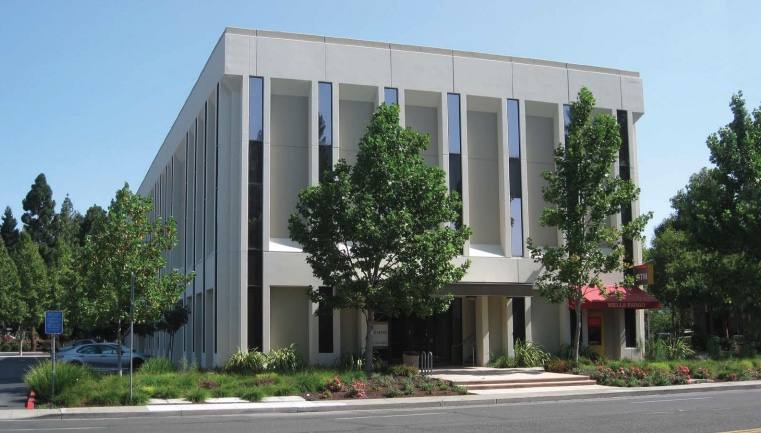
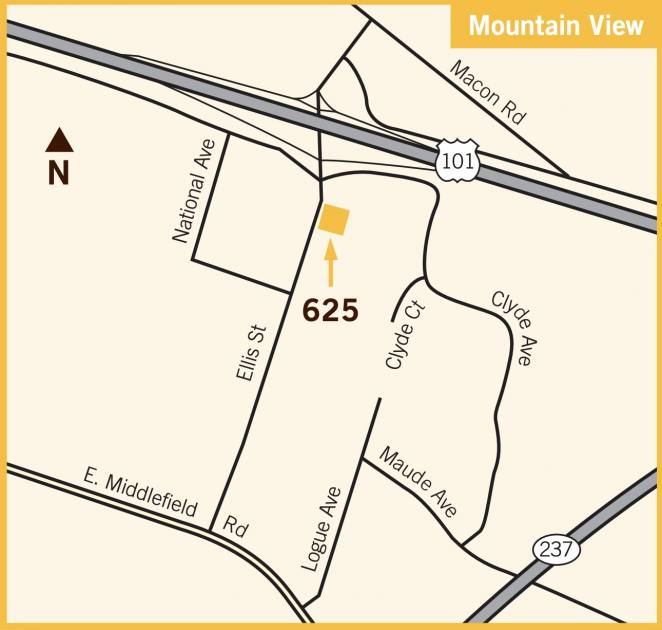
625 Ellis Street Mountain View, CA 94043
625 Ellis Street Mountain View, CA 94043
Details & Description
Property Highlights
- • Available immediately
- • 4.33/1,000 sf parking ratio
- • Full service lease and on-site property management
- • Immediate access to 101
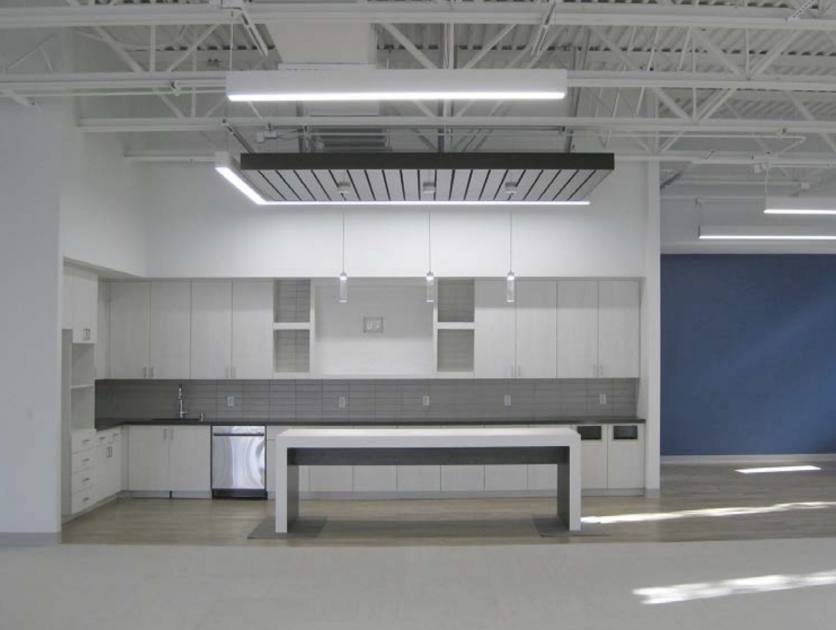
- • Shower and locker facilities in building
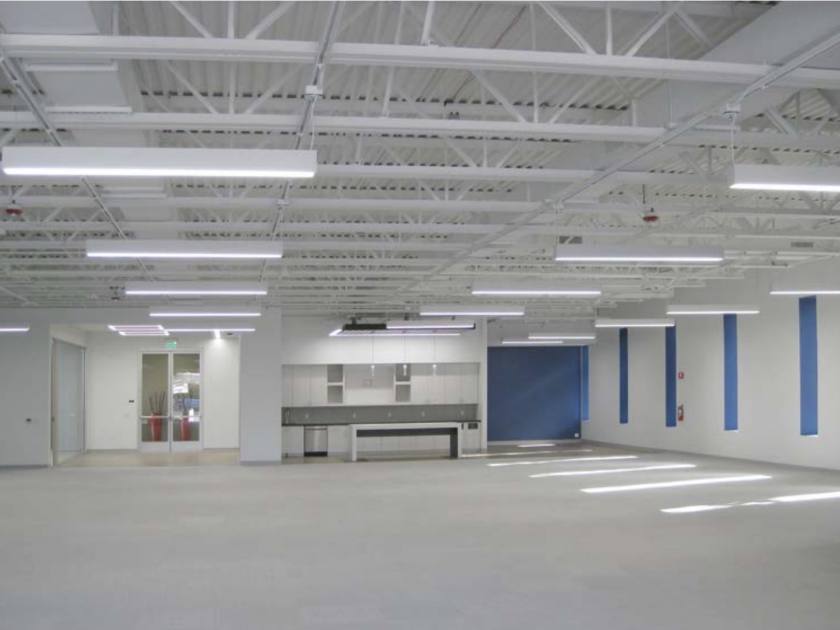
Additional Photos

Listing Agents

David Conklin
Renault & Handley
O: 650-321-3040
M: 650-461-2202
dconklin@renault-handley.com
Renault & Handley
O: 650-321-3040
M: 650-461-2202
dconklin@renault-handley.com

Geordie Mckee
Renault & Handley
O: 650-321-3040
M: 650-461-2208
gmckee@renault-handley.com
Renault & Handley
O: 650-321-3040
M: 650-461-2208
gmckee@renault-handley.com
While we strive to provide the most accurate information, all listing information, and demographic data, is provided by third-parties. As such, MyEListing will not be responsible for the accuracy of the information. It is strongly recommended that you verify all information with the listing agent, and any relevant agencies, prior to making any decisions.