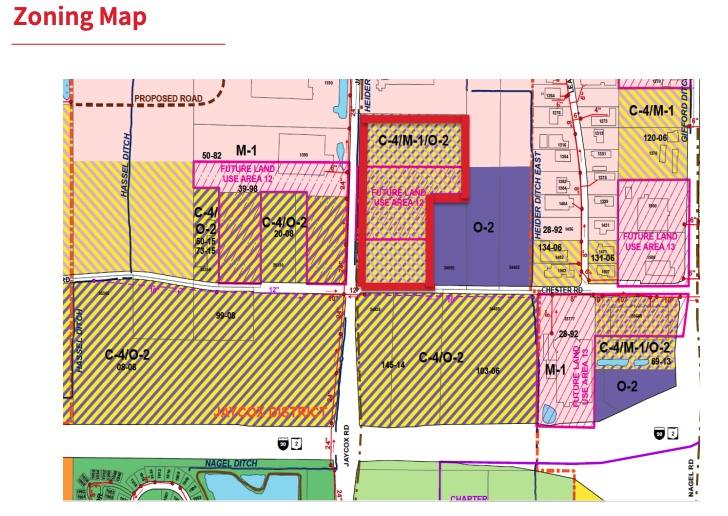
1-Mile | 3-Miles | 5-Miles | ||
---|---|---|---|---|
Total Population | 2,808 | 46,511 | 119,711 | |
Population Median Age | 42 | 41 | 41 | |
Population by Age | 0-9 Yrs | 388 (13%) | 5804 (12%) | 13830 (11%) |
10-19 Yrs | 381 (13%) | 6721 (14%) | 17153 (14%) | |
20-29 Yrs | 160 (5%) | 3113 (6%) | 10129 (8%) | |
30-39 Yrs | 337 (12%) | 4952 (10%) | 12950 (10%) | |
40-49 Yrs | 488 (17%) | 7132 (15%) | 17524 (14%) | |
50-59 Yrs | 299 (10%) | 6673 (14%) | 17157 (14%) | |
60-69 Yrs | 252 (8%) | 5754 (12%) | 15087 (12%) | |
70+ Yrs | 503 (17%) | 6361 (13%) | 15882 (13%) | |
Median HH Income | $100,061 | $96,742 | $88,153 | |
Total Household Income | < 24K | 83 (7%) | 1678 (9%) | 4848 (10%) |
25-49K | 229 (21%) | 2812 (15%) | 7675 (16%) | |
50-74K | 129 (12%) | 2668 (14%) | 7403 (15%) | |
75-99K | 83 (7%) | 2239 (12%) | 6514 (13%) | |
100-199K | 283 (27%) | 5836 (32%) | 13972 (29%) | |
200K+ | 241 (22%) | 2978 (16%) | 6294 (13%) | |
Highest Education Level | No Diploma | 50 | 940 | 3818 |
Diploma or GED | 401 | 5159 | 15767 | |
Some College | 382 | 5846 | 15855 | |
Assoc. Degree | 108 | 2440 | 6905 | |
Bachelors Degree | 551 | 10667 | 25094 | |
Higher Degree | 443 | 7318 | 16559 | |
Total Housing Units | 1,134 | 19,243 | 49,408 | |
--Owner-Occupied | 907 | 14,728 | 37,472 | |
--Renter-Occupied | 141 | 3,483 | 9,234 | |
Owner-Occupied Values | < 100K | 17 | 673 | 2782 |
100-199K | 253 | 3234 | 12359 | |
200-299K | 221 | 4167 | 9656 | |
300-399K | 247 | 3603 | 6812 | |
400-499K | 116 | 1679 | 2830 | |
500K+ | 53 | 1372 | 3033 | |
Total Working Age Population | 2,143 | 36,188 | 94,672 | |
In Work Force | 1,243 | 23,369 | 61,685 | |
Not In Work Force | 900 | 12,819 | 32,987 | |
Workforce Employed | 1,231 | 22,733 | 59,792 | |
Workforce Unemployed | 12 | 622 | 1,845 | |
Civlian Workforce | 1,243 | 23,354 | 61,637 | |
Military Workforce | 0 | 15 | 48 | |
Total Households | 1,048 | 18,211 | 46,706 | |
Family Households | 746 | 12,787 | 32,075 | |
Non-Family Households | 302 | 5,424 | 14,631 | |
Married Couple | 612 | 11,044 | 26,713 | |
Other Family | 134 | 1,743 | 5,362 | |
Married w/Child | 307 | 4,833 | 11,410 | |
Single Male w/Child | 34 | 354 | 997 | |
Single Female w/Child | 31 | 607 | 1,840 |
Population Change Last Two Decades - Plus Projection
2000 | % | 2010 | % | 2020 | % | 2030 | |
---|---|---|---|---|---|---|---|
Ohio | 11,353,140 | +2 | 11,536,504 | 0 | 11,574,870 | 0 | 11,615,100 |
Cuyahoga County | 1,393,978 | -8 | 1,280,122 | -6 | 1,209,550 | -5 | 1,154,210 |
Lorain County | 284,664 | +6 | 301,356 | +3 | 310,230 | +3 | 320,430 |
Total Working Age Population:
Total Households:
Total Working Age Population:
Total Households:
Total Working Age Population:
Total Households: