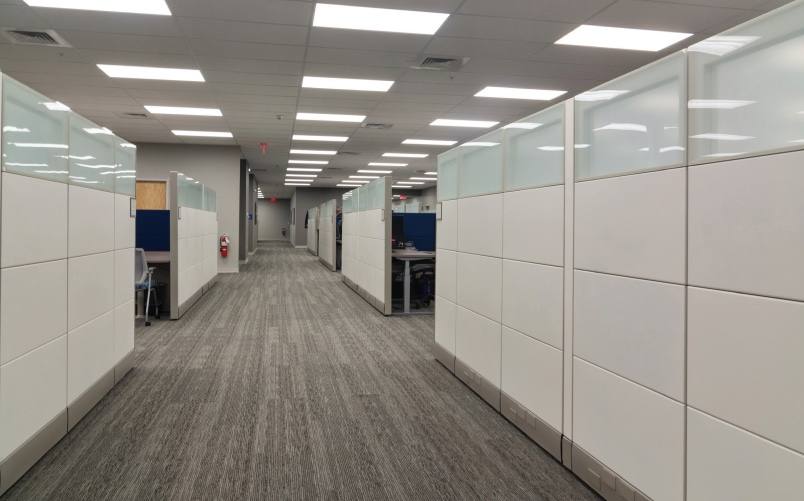
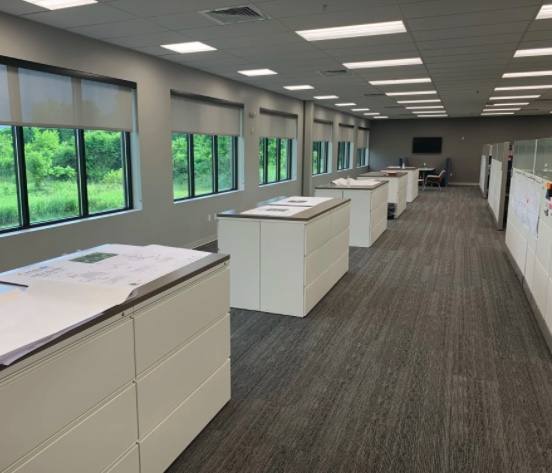
Office Space
8701 Port Jackson Avenue Northwest North Canton, OH 44720
8701 Port Jackson Avenue Northwest North Canton, OH 44720
Details & Description
Property Highlights
- • Term through 11-30-2030
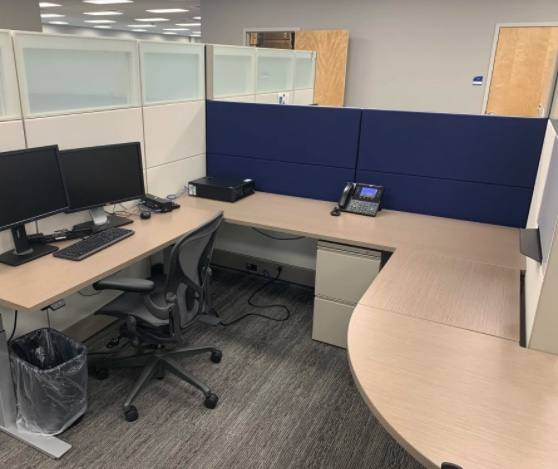
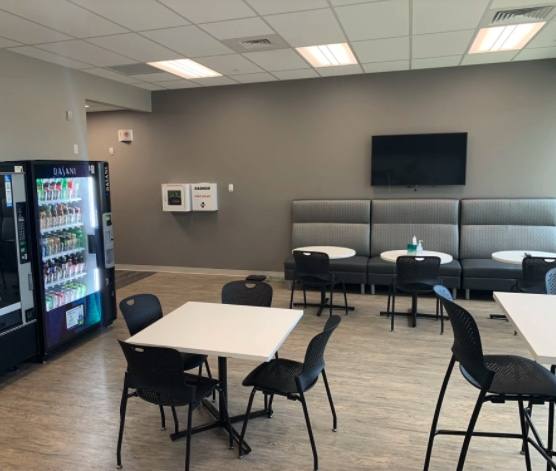
- • Modern finishes throughout
- • Abundant surface parking
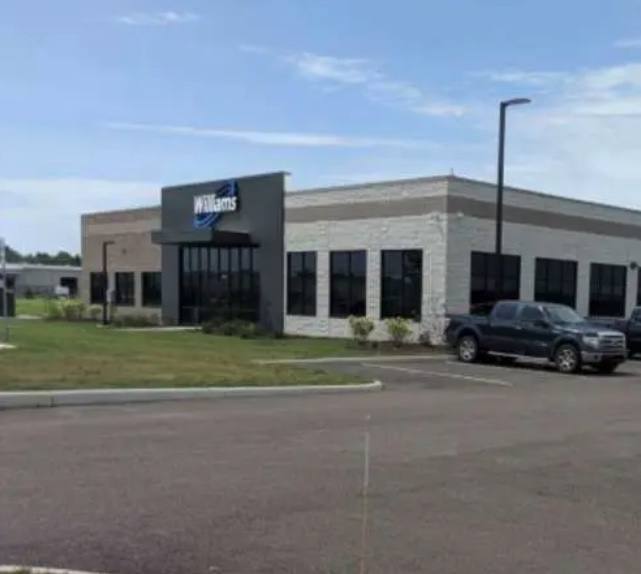
- • Adjacent to I-77
- • Perfect location for company HQ
- • Onsite fitness facility
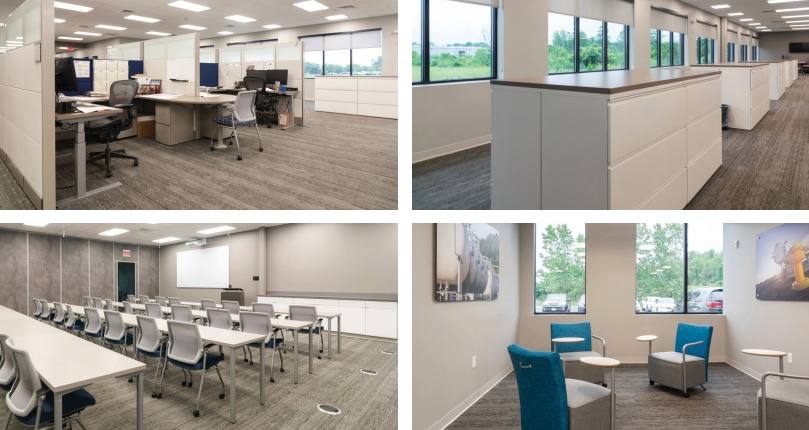
Additional Photos
Listing Agents

Warren Blazy III
O: 216-937-4372
warren.blazy@am.jll.com
O: 216-937-4372
warren.blazy@am.jll.com

Eric Smith
JLL
O: 216-937-4391
eric.smith@am.jll.com
JLL
O: 216-937-4391
eric.smith@am.jll.com
While we strive to provide the most accurate information, all listing information, and demographic data, is provided by third-parties. As such, MyEListing will not be responsible for the accuracy of the information. It is strongly recommended that you verify all information with the listing agent, and any relevant agencies, prior to making any decisions.