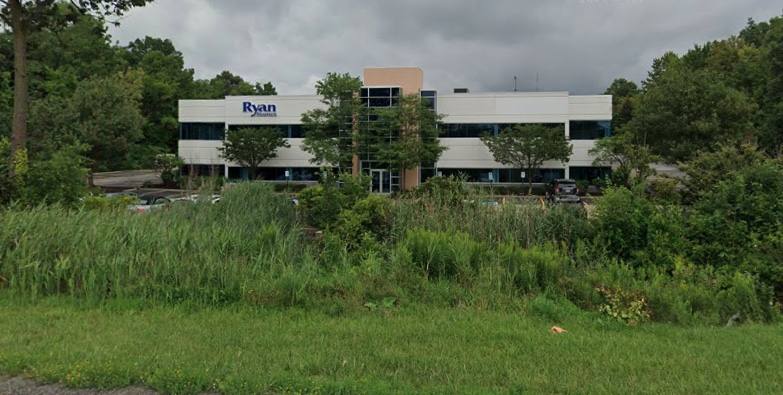
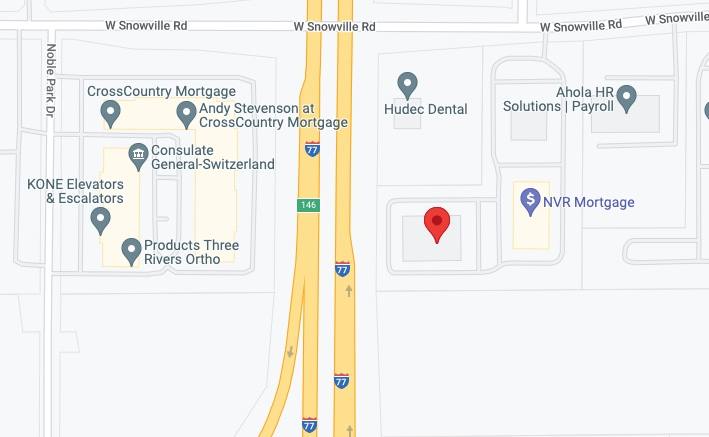
1-Mile | 3-Miles | 5-Miles | ||
---|---|---|---|---|
Total Population | 1,759 | 13,823 | 47,126 | |
Population Median Age | 42 | 43 | 43 | |
Population by Age | 0-9 Yrs | 207 (11%) | 1486 (10%) | 4682 (9%) |
10-19 Yrs | 243 (13%) | 1681 (12%) | 5845 (12%) | |
20-29 Yrs | 154 (8%) | 1194 (8%) | 4306 (9%) | |
30-39 Yrs | 173 (9%) | 1293 (9%) | 4586 (9%) | |
40-49 Yrs | 202 (11%) | 1675 (12%) | 6208 (13%) | |
50-59 Yrs | 291 (16%) | 2341 (16%) | 7935 (16%) | |
60-69 Yrs | 289 (16%) | 2324 (16%) | 7480 (15%) | |
70+ Yrs | 200 (11%) | 1830 (13%) | 6083 (12%) | |
Median HH Income | $119,462 | $112,101 | $95,639 | |
Total Household Income | < 24K | 38 (5%) | 396 (7%) | 1749 (9%) |
25-49K | 74 (11%) | 695 (13%) | 2616 (13%) | |
50-74K | 56 (8%) | 555 (10%) | 2964 (15%) | |
75-99K | 79 (12%) | 678 (12%) | 2711 (14%) | |
100-199K | 247 (38%) | 1876 (35%) | 5989 (31%) | |
200K+ | 141 (22%) | 1115 (20%) | 3107 (16%) | |
Highest Education Level | No Diploma | 31 | 278 | 1024 |
Diploma or GED | 242 | 1925 | 7195 | |
Some College | 174 | 1818 | 6634 | |
Assoc. Degree | 58 | 615 | 2674 | |
Bachelors Degree | 421 | 3244 | 10190 | |
Higher Degree | 328 | 2272 | 6864 | |
Total Housing Units | 661 | 5,543 | 20,078 | |
--Owner-Occupied | 542 | 4,704 | 15,968 | |
--Renter-Occupied | 92 | 611 | 3,169 | |
Owner-Occupied Values | < 100K | 1 | 108 | 1104 |
100-199K | 72 | 785 | 4098 | |
200-299K | 156 | 1645 | 4867 | |
300-399K | 146 | 1032 | 2975 | |
400-499K | 60 | 458 | 1340 | |
500K+ | 108 | 676 | 1584 | |
Total Working Age Population | 1,370 | 11,203 | 38,907 | |
In Work Force | 906 | 7,454 | 25,918 | |
Not In Work Force | 464 | 3,749 | 12,989 | |
Workforce Employed | 856 | 7,153 | 25,084 | |
Workforce Unemployed | 49 | 300 | 834 | |
Civlian Workforce | 906 | 7,454 | 25,918 | |
Military Workforce | 0 | 0 | 0 | |
Total Households | 634 | 5,315 | 19,137 | |
Family Households | 493 | 3,950 | 13,036 | |
Non-Family Households | 141 | 1,365 | 6,100 | |
Married Couple | 440 | 3,518 | 11,255 | |
Other Family | 53 | 432 | 1,781 | |
Married w/Child | 185 | 1,328 | 3,970 | |
Single Male w/Child | 1 | 22 | 173 | |
Single Female w/Child | 33 | 207 | 693 |
Population Change Last Two Decades - Plus Projection
2000 | % | 2010 | % | 2020 | % | 2030 | |
---|---|---|---|---|---|---|---|
Ohio | 11,353,140 | +2 | 11,536,504 | 0 | 11,574,870 | 0 | 11,615,100 |
Cuyahoga County | 1,393,978 | -8 | 1,280,122 | -6 | 1,209,550 | -5 | 1,154,210 |
Medina County | 151,095 | +14 | 172,332 | +7 | 184,670 | +5 | 194,510 |
Summit County | 542,899 | 0 | 541,781 | -1 | 534,150 | -1 | 528,990 |
Total Working Age Population:
Total Households:
Total Working Age Population:
Total Households:
Total Working Age Population:
Total Households: