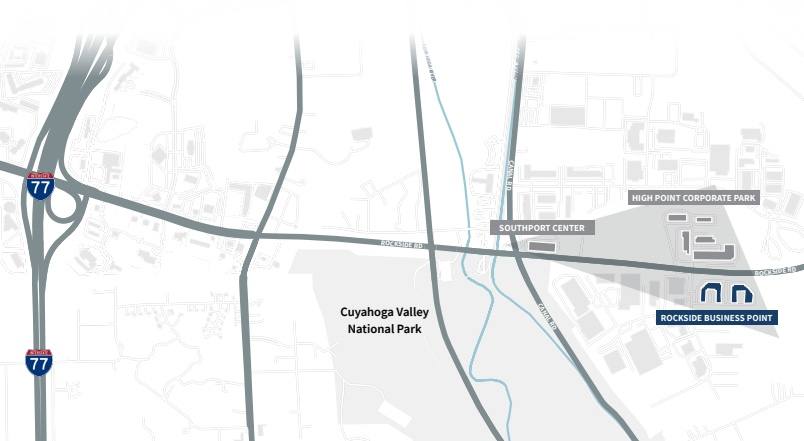
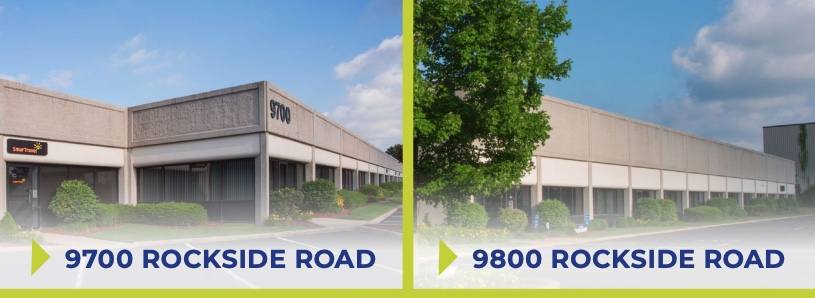
1-Mile | 3-Miles | 5-Miles | ||
---|---|---|---|---|
Total Population | 1,322 | 48,153 | 178,306 | |
Population Median Age | 42 | 41 | 41 | |
Population by Age | 0-9 Yrs | 134 (10%) | 5570 (11%) | 19853 (11%) |
10-19 Yrs | 177 (13%) | 5718 (11%) | 21407 (12%) | |
20-29 Yrs | 148 (11%) | 5624 (11%) | 21529 (12%) | |
30-39 Yrs | 133 (10%) | 5915 (12%) | 20851 (11%) | |
40-49 Yrs | 180 (13%) | 5932 (12%) | 21887 (12%) | |
50-59 Yrs | 178 (13%) | 7200 (14%) | 26467 (14%) | |
60-69 Yrs | 204 (15%) | 6534 (13%) | 24147 (13%) | |
70+ Yrs | 168 (12%) | 5660 (11%) | 22165 (12%) | |
Median HH Income | $57,969 | $53,525 | $46,866 | |
Total Household Income | < 24K | 93 (16%) | 4054 (20%) | 19406 (25%) |
25-49K | 153 (26%) | 5287 (26%) | 20378 (27%) | |
50-74K | 96 (16%) | 4123 (20%) | 13853 (18%) | |
75-99K | 72 (12%) | 2433 (12%) | 8245 (10%) | |
100-199K | 126 (22%) | 3503 (17%) | 11296 (14%) | |
200K+ | 27 (4%) | 675 (3%) | 2221 (2%) | |
Highest Education Level | No Diploma | 42 | 2981 | 13968 |
Diploma or GED | 318 | 12452 | 44237 | |
Some College | 242 | 8157 | 30465 | |
Assoc. Degree | 90 | 2872 | 11002 | |
Bachelors Degree | 163 | 4928 | 17488 | |
Higher Degree | 65 | 2719 | 9320 | |
Total Housing Units | 609 | 22,311 | 87,214 | |
--Owner-Occupied | 406 | 14,087 | 49,222 | |
--Renter-Occupied | 160 | 5,988 | 26,178 | |
Owner-Occupied Values | < 100K | 117 | 8092 | 26260 |
100-199K | 131 | 3333 | 14473 | |
200-299K | 97 | 1588 | 5232 | |
300-399K | 41 | 585 | 1823 | |
400-499K | 12 | 310 | 713 | |
500K+ | 9 | 180 | 721 | |
Total Working Age Population | 1,061 | 39,388 | 145,889 | |
In Work Force | 708 | 26,115 | 90,631 | |
Not In Work Force | 353 | 13,273 | 55,259 | |
Workforce Employed | 679 | 24,304 | 82,739 | |
Workforce Unemployed | 29 | 1,796 | 7,866 | |
Civlian Workforce | 708 | 26,100 | 90,605 | |
Military Workforce | 0 | 15 | 26 | |
Total Households | 567 | 20,075 | 75,399 | |
Family Households | 354 | 12,189 | 44,597 | |
Non-Family Households | 213 | 7,886 | 30,802 | |
Married Couple | 217 | 7,835 | 26,126 | |
Other Family | 137 | 4,355 | 18,471 | |
Married w/Child | 54 | 2,500 | 8,140 | |
Single Male w/Child | 16 | 487 | 1,550 | |
Single Female w/Child | 63 | 1,700 | 7,168 |
Population Change Last Two Decades - Plus Projection
2000 | % | 2010 | % | 2020 | % | 2030 | |
---|---|---|---|---|---|---|---|
Ohio | 11,353,140 | +2 | 11,536,504 | 0 | 11,574,870 | 0 | 11,615,100 |
Cuyahoga County | 1,393,978 | -8 | 1,280,122 | -6 | 1,209,550 | -5 | 1,154,210 |
Summit County | 542,899 | 0 | 541,781 | -1 | 534,150 | -1 | 528,990 |
Total Working Age Population:
Total Households:
Total Working Age Population:
Total Households:
Total Working Age Population:
Total Households: