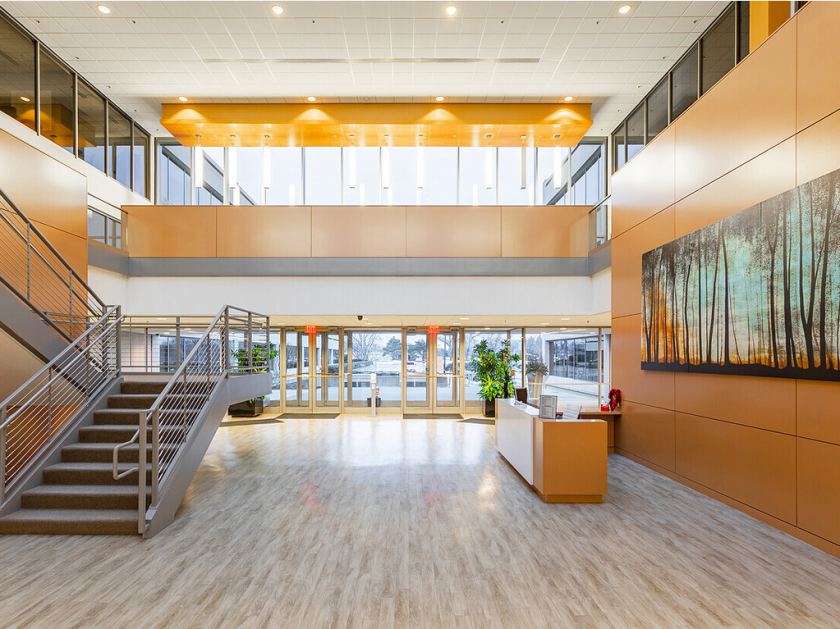
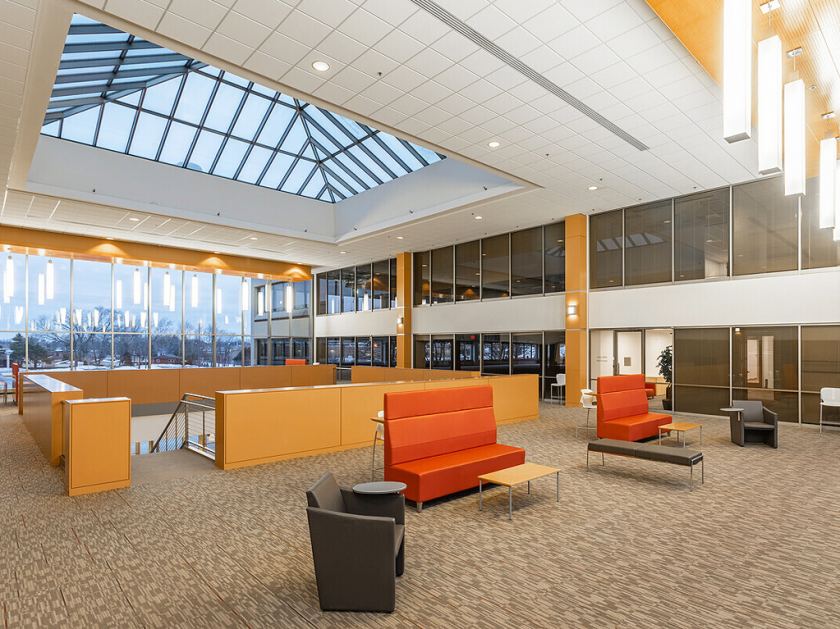
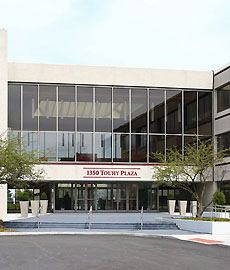
1-Mile | 3-Miles | 5-Miles | ||
---|---|---|---|---|
Total Population | 11,666 | 91,841 | 305,112 | |
Population Median Age | 39 | 41 | 41 | |
Population by Age | 0-9 Yrs | 1316 (11%) | 10434 (11%) | 35577 (11%) |
10-19 Yrs | 1474 (12%) | 11244 (12%) | 32944 (10%) | |
20-29 Yrs | 1646 (14%) | 9939 (10%) | 34417 (11%) | |
30-39 Yrs | 1533 (13%) | 12167 (13%) | 41265 (13%) | |
40-49 Yrs | 1498 (12%) | 12382 (13%) | 39800 (13%) | |
50-59 Yrs | 1777 (15%) | 13120 (14%) | 44394 (14%) | |
60-69 Yrs | 1281 (10%) | 10812 (11%) | 36492 (11%) | |
70+ Yrs | 1142 (9%) | 11742 (12%) | 40225 (13%) | |
Median HH Income | $75,753 | $74,457 | $72,636 | |
Total Household Income | < 24K | 458 (12%) | 4843 (13%) | 18385 (15%) |
25-49K | 712 (18%) | 6726 (19%) | 22125 (19%) | |
50-74K | 697 (18%) | 5877 (16%) | 19390 (16%) | |
75-99K | 702 (18%) | 4753 (13%) | 15690 (13%) | |
100-199K | 1001 (26%) | 9054 (26%) | 30065 (25%) | |
200K+ | 206 (5%) | 3388 (9%) | 10763 (9%) | |
Highest Education Level | No Diploma | 1415 | 7898 | 24684 |
Diploma or GED | 2230 | 14400 | 52781 | |
Some College | 1350 | 11454 | 41065 | |
Assoc. Degree | 776 | 5237 | 17568 | |
Bachelors Degree | 1679 | 17244 | 54985 | |
Higher Degree | 647 | 9493 | 30743 | |
Total Housing Units | 3,907 | 36,826 | 123,719 | |
--Owner-Occupied | 2,752 | 24,766 | 80,727 | |
--Renter-Occupied | 1,023 | 9,874 | 35,691 | |
Owner-Occupied Values | < 100K | 118 | 2200 | 5682 |
100-199K | 607 | 4449 | 14638 | |
200-299K | 1305 | 7348 | 22679 | |
300-399K | 463 | 5191 | 19562 | |
400-499K | 93 | 2455 | 9066 | |
500K+ | 166 | 3124 | 9101 | |
Total Working Age Population | 9,676 | 74,769 | 249,330 | |
In Work Force | 6,478 | 49,573 | 163,398 | |
Not In Work Force | 3,198 | 25,195 | 85,932 | |
Workforce Employed | 6,118 | 47,444 | 156,656 | |
Workforce Unemployed | 360 | 2,115 | 6,660 | |
Civlian Workforce | 6,478 | 49,558 | 163,316 | |
Military Workforce | 0 | 15 | 82 | |
Total Households | 3,775 | 34,640 | 116,418 | |
Family Households | 2,805 | 22,952 | 78,302 | |
Non-Family Households | 970 | 11,688 | 38,116 | |
Married Couple | 2,093 | 17,983 | 61,971 | |
Other Family | 713 | 4,968 | 16,331 | |
Married w/Child | 750 | 7,519 | 25,236 | |
Single Male w/Child | 107 | 583 | 1,684 | |
Single Female w/Child | 222 | 1,582 | 4,704 |
Population Change Last Two Decades - Plus Projection
2000 | % | 2010 | % | 2020 | % | 2030 | |
---|---|---|---|---|---|---|---|
Illinois | 12,419,293 | +3 | 12,830,632 | +12 | 14,316,487 | +6 | 15,138,849 |
Cook County | 5,376,741 | -3 | 5,194,675 | +10 | 5,707,832 | +5 | 5,990,243 |
DuPage County | 904,161 | +1 | 916,924 | +10 | 1,010,323 | +2 | 1,034,039 |
Total Working Age Population:
Total Households:
Total Working Age Population:
Total Households:
Total Working Age Population:
Total Households: