Retail Space
1460 French Road Depew, NY 14043
1460 French Road Depew, NY 14043

Details & Description
Property Highlights
- • Northwest Quadrant of French and Transit Roads
- • Path of Progress Area
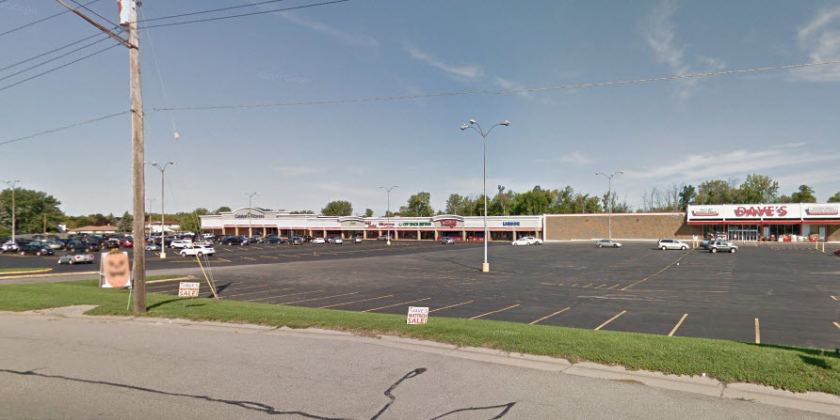
- • Great Signage on Two Streets
Listing Agents

Rick Recckio
O: 716-631-5555
M: 716-998-4422
rick@recckio.com
O: 716-631-5555
M: 716-998-4422
rick@recckio.com
While we strive to provide the most accurate information, all listing information, and demographic data, is provided by third-parties. As such, MyEListing will not be responsible for the accuracy of the information. It is strongly recommended that you verify all information with the listing agent, and any relevant agencies, prior to making any decisions.