Retail Space
1107 South Gilbert Road Mesa, AZ 85204
1107 South Gilbert Road Mesa, AZ 85204
Details & Description
Property Highlights
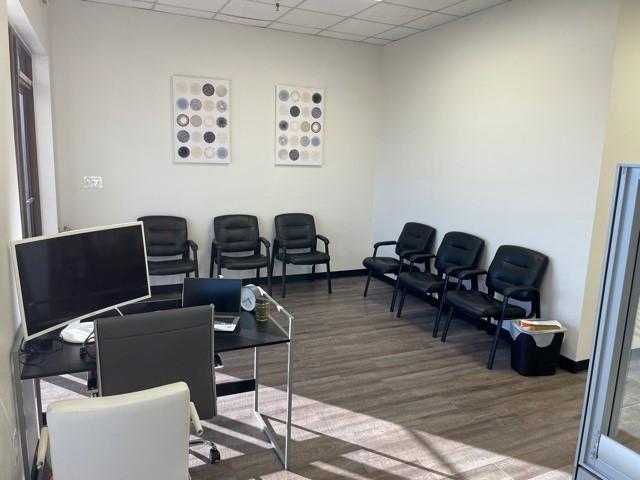
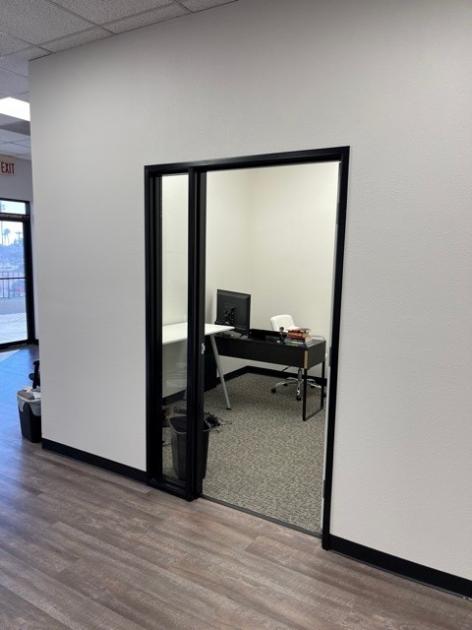
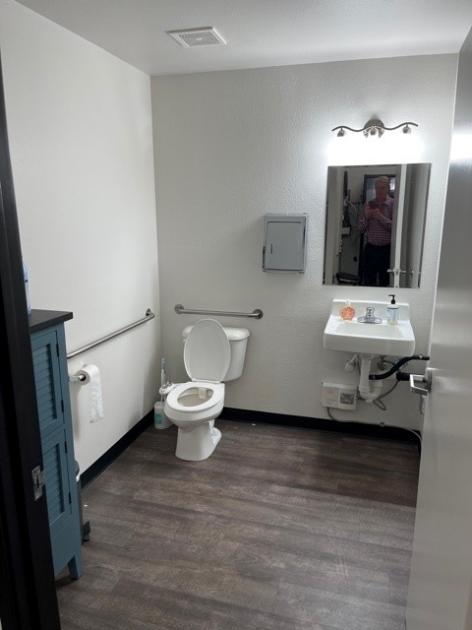
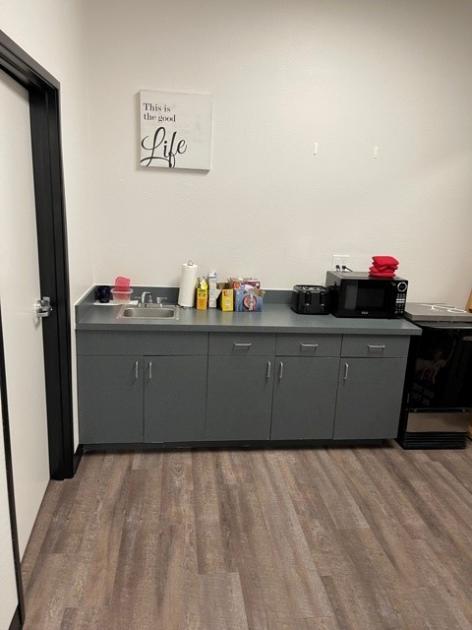
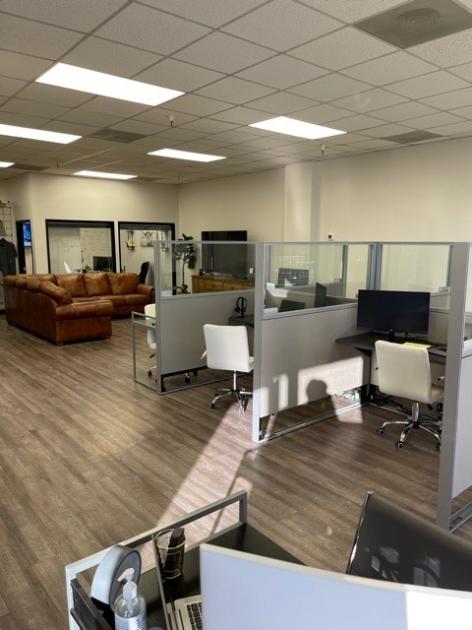
- • 1,550 SF officeretail space
- • Below market rental rate $12 SFYr NNN lease option
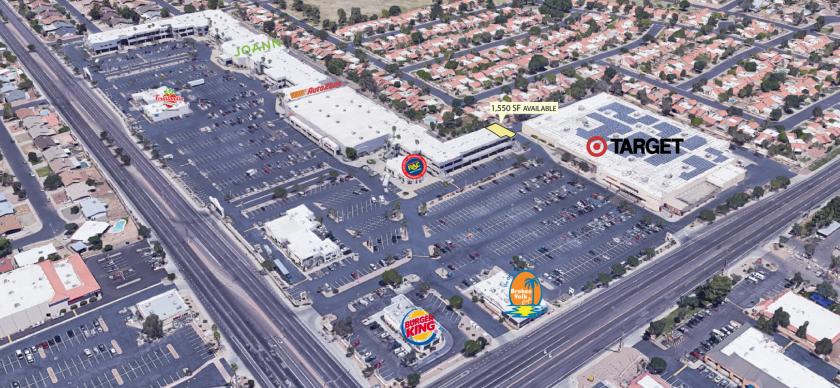
- • Established trade area with over 58,749 VPD
- • Central East Valley Location
- • Easy access off US 60 Hwy
Additional Photos
Listing Agents

Russ Rodgers
O: 480-610-2400
M: 214-609-4413
russ@coberealestate.com
O: 480-610-2400
M: 214-609-4413
russ@coberealestate.com
While we strive to provide the most accurate information, all listing information, and demographic data, is provided by third-parties. As such, MyEListing will not be responsible for the accuracy of the information. It is strongly recommended that you verify all information with the listing agent, and any relevant agencies, prior to making any decisions.