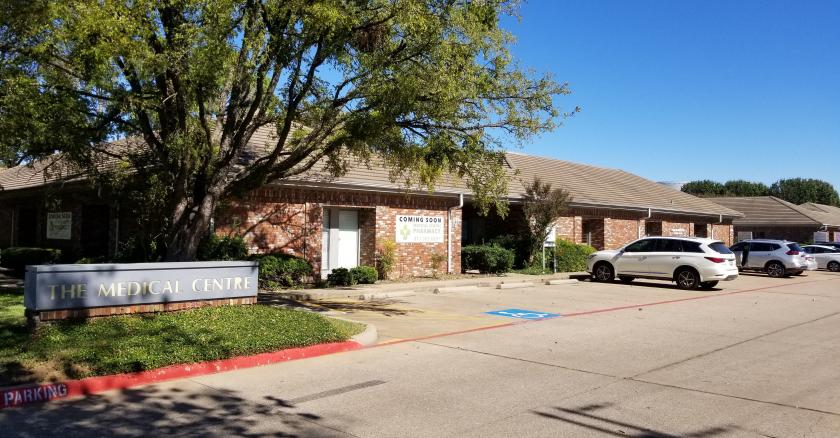
Office Space
911 Medical Centre Drive Arlington, TX 76012
911 Medical Centre Drive Arlington, TX 76012
Details & Description
Property Highlights
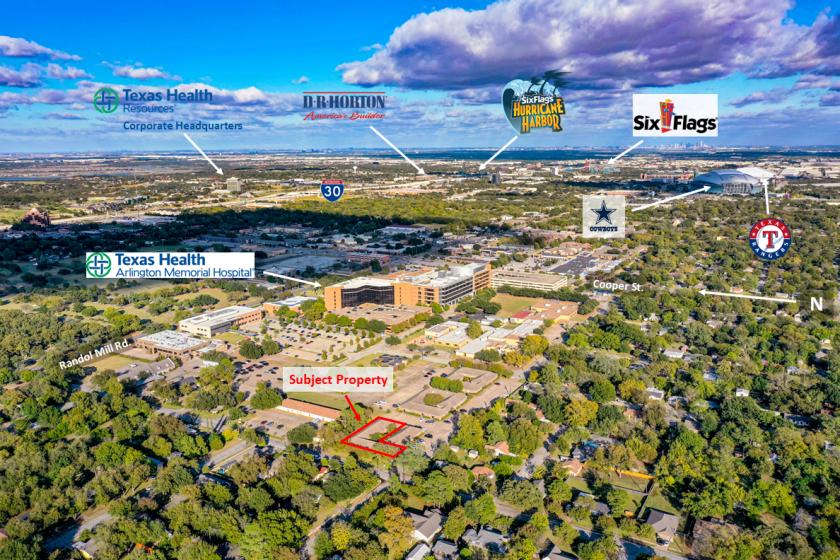
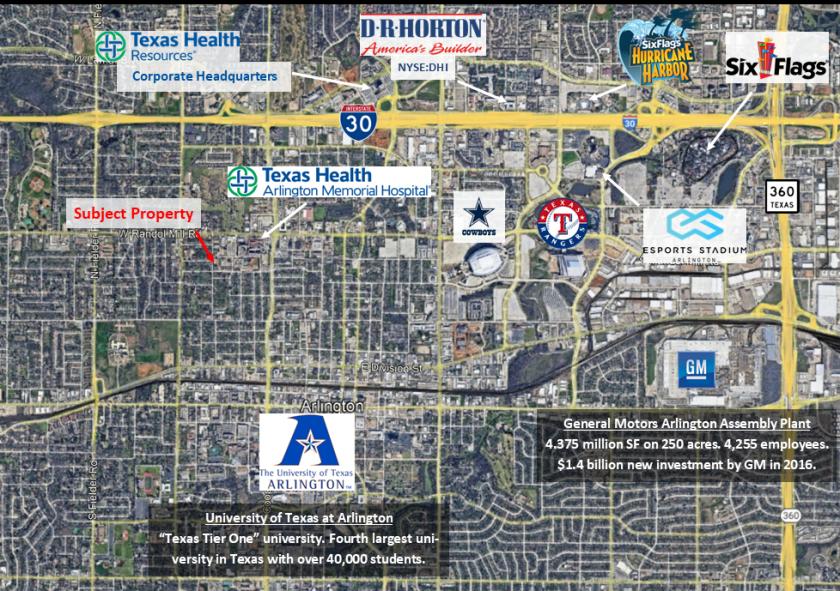
• Population of the Dallas-Fort Worth-Arlington MSA Has Increased Almost 10 in the Past 5 Years
• 7.3 Cap in Year 2 Due to 8 Rent Escalation Approx. 4 Bumps Thereafter
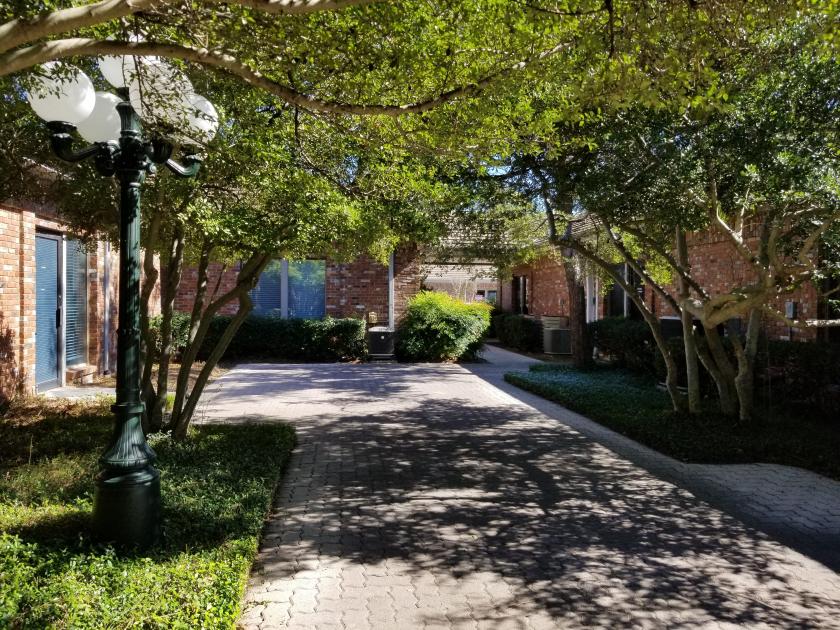
Additional Photos

Listing Agents

Shane Benner
O: 817-921-8178
sbenner@bradford.com
O: 817-921-8178
sbenner@bradford.com
While we strive to provide the most accurate information, all listing information, and demographic data, is provided by third-parties. As such, MyEListing will not be responsible for the accuracy of the information. It is strongly recommended that you verify all information with the listing agent, and any relevant agencies, prior to making any decisions.


