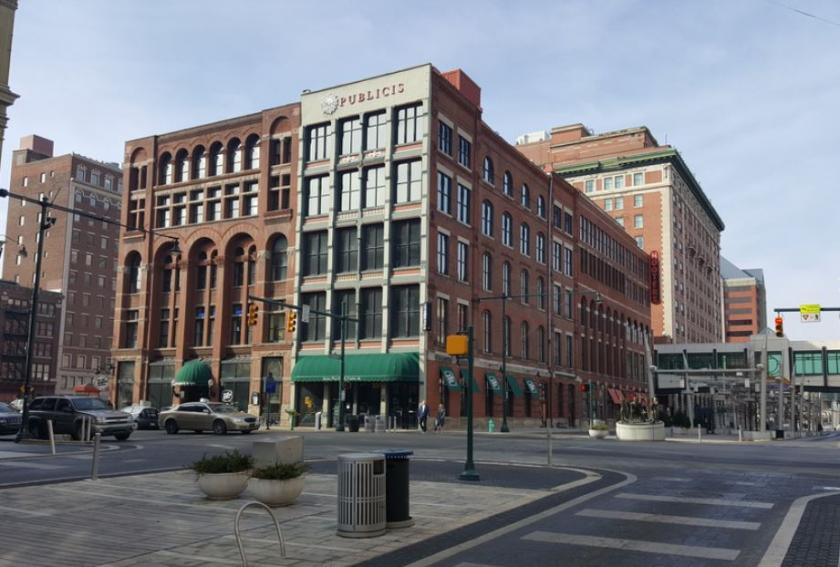
Office Space
200 South Meridian Street Indianapolis, IN 46225
200 South Meridian Street Indianapolis, IN 46225
Details & Description
Property Highlights
• Conveniently Located - Located directly on South Meridian a few steps from the Indianapolis Convention Center
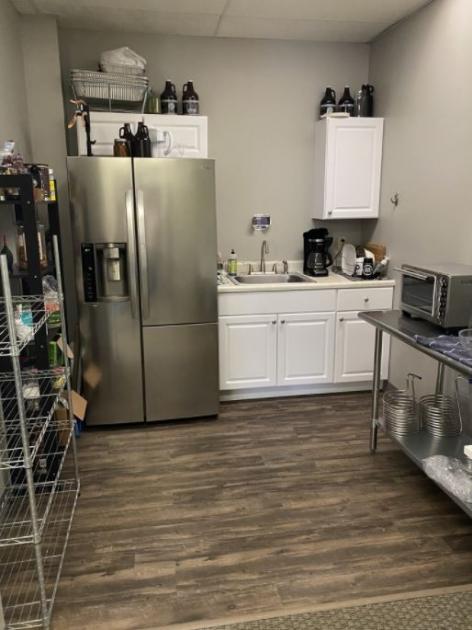
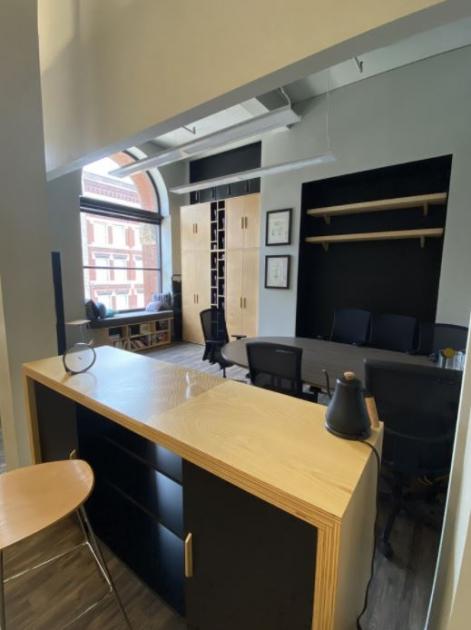
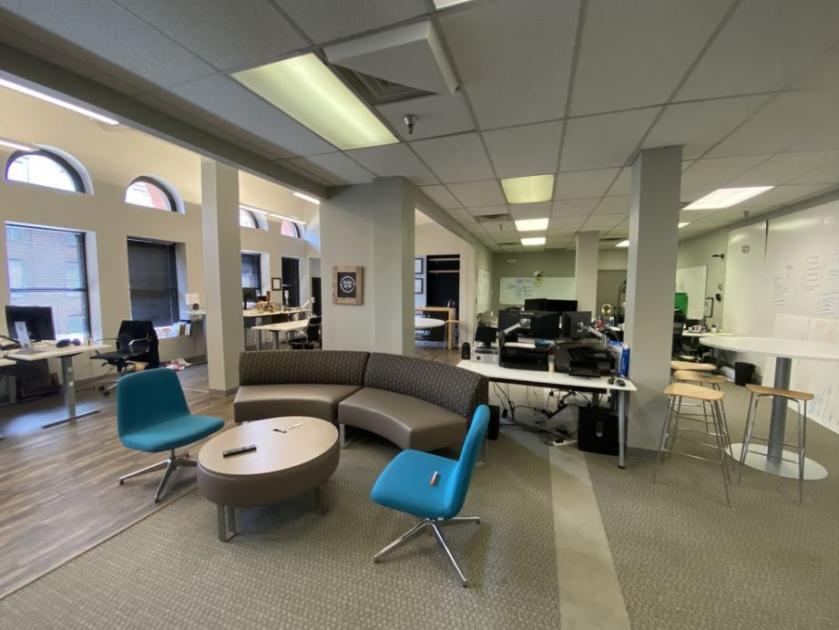
• Desirable Interior - Recently renovated space with a mix of modern finishes and abundant natural light
Additional Photos
Listing Agents

Mike Short
O: 317-853-7502
mike@alopg.com
O: 317-853-7502
mike@alopg.com
While we strive to provide the most accurate information, all listing information, and demographic data, is provided by third-parties. As such, MyEListing will not be responsible for the accuracy of the information. It is strongly recommended that you verify all information with the listing agent, and any relevant agencies, prior to making any decisions.


