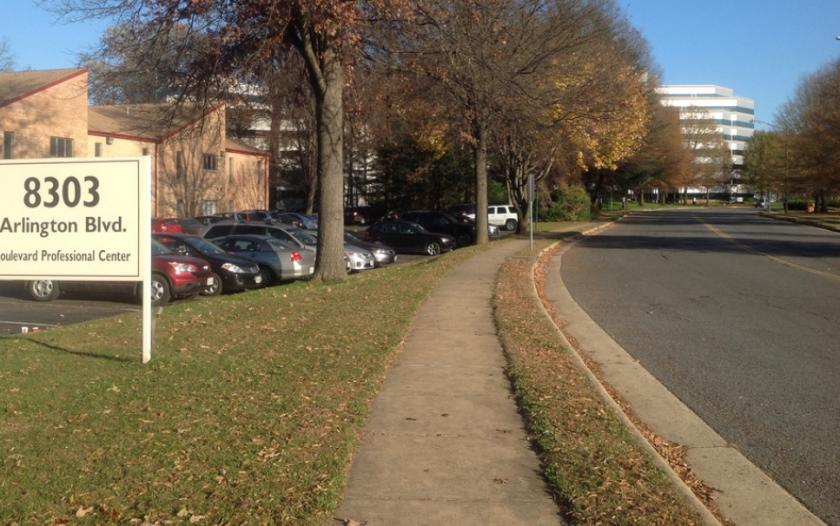
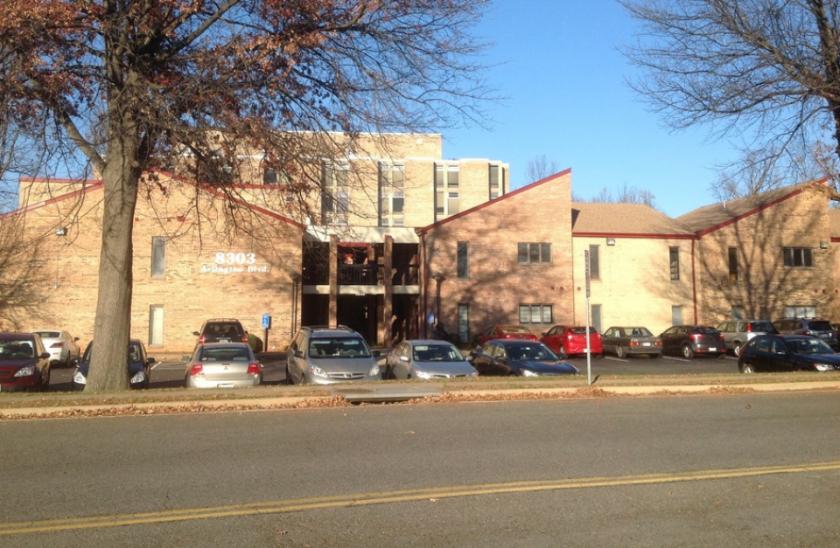
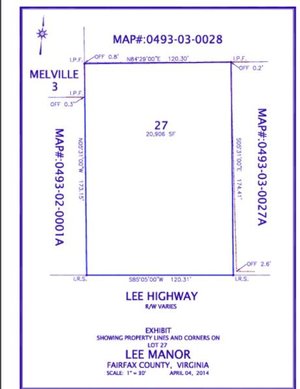
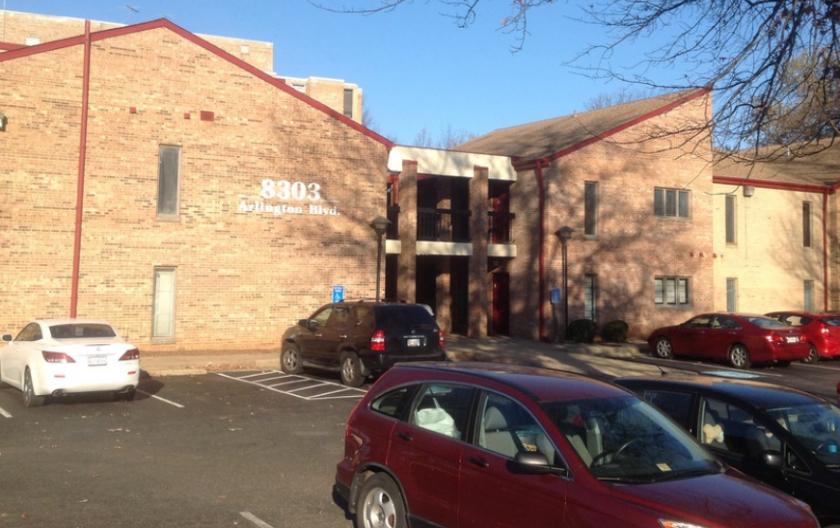
1-Mile | 3-Miles | 5-Miles | ||
---|---|---|---|---|
Total Population | 14,406 | 144,685 | 369,177 | |
Population Median Age | 37 | 37 | 38 | |
Population by Age | 0-9 Yrs | 1802 (12%) | 17740 (12%) | 46470 (12%) |
10-19 Yrs | 928 (6%) | 17064 (11%) | 46094 (12%) | |
20-29 Yrs | 3032 (21%) | 20746 (14%) | 48063 (13%) | |
30-39 Yrs | 3135 (21%) | 24304 (16%) | 56131 (15%) | |
40-49 Yrs | 1666 (11%) | 20316 (14%) | 51346 (13%) | |
50-59 Yrs | 1370 (9%) | 18721 (12%) | 48373 (13%) | |
60-69 Yrs | 1489 (10%) | 14365 (9%) | 39165 (10%) | |
70+ Yrs | 984 (6%) | 11429 (7%) | 33535 (9%) | |
Median HH Income | $115,438 | $117,214 | $124,574 | |
Total Household Income | < 24K | 384 (6%) | 4362 (8%) | 10291 (7%) |
25-49K | 678 (10%) | 5530 (10%) | 13150 (10%) | |
50-74K | 688 (11%) | 6002 (11%) | 13934 (10%) | |
75-99K | 852 (13%) | 6103 (11%) | 14342 (11%) | |
100-199K | 2545 (41%) | 17563 (34%) | 44775 (34%) | |
200K+ | 1043 (16%) | 11972 (23%) | 33820 (25%) | |
Highest Education Level | No Diploma | 543 | 9937 | 21482 |
Diploma or GED | 1200 | 13262 | 30153 | |
Some College | 1234 | 11366 | 28385 | |
Assoc. Degree | 613 | 5334 | 12138 | |
Bachelors Degree | 3774 | 30545 | 77700 | |
Higher Degree | 3244 | 30004 | 83383 | |
Total Housing Units | 6,774 | 54,169 | 136,682 | |
--Owner-Occupied | 2,453 | 30,480 | 85,187 | |
--Renter-Occupied | 3,737 | 21,053 | 45,124 | |
Owner-Occupied Values | < 100K | 32 | 342 | 848 |
100-199K | 129 | 1104 | 2453 | |
200-299K | 244 | 1807 | 4524 | |
300-399K | 337 | 2156 | 6458 | |
400-499K | 487 | 5117 | 13258 | |
500K+ | 1224 | 19954 | 57647 | |
Total Working Age Population | 12,221 | 116,586 | 295,337 | |
In Work Force | 9,532 | 86,257 | 210,423 | |
Not In Work Force | 2,689 | 30,329 | 84,914 | |
Workforce Employed | 9,252 | 82,867 | 200,501 | |
Workforce Unemployed | 205 | 2,749 | 8,015 | |
Civlian Workforce | 9,457 | 85,616 | 208,516 | |
Military Workforce | 75 | 641 | 1,907 | |
Total Households | 6,190 | 51,533 | 130,311 | |
Family Households | 3,238 | 34,595 | 89,622 | |
Non-Family Households | 2,953 | 16,938 | 40,690 | |
Married Couple | 2,439 | 27,188 | 72,657 | |
Other Family | 799 | 7,407 | 16,964 | |
Married w/Child | 941 | 12,721 | 34,382 | |
Single Male w/Child | 67 | 891 | 2,115 | |
Single Female w/Child | 366 | 2,511 | 5,803 |
Population Change Last Two Decades - Plus Projection
2000 | % | 2010 | % | 2020 | % | 2030 | |
---|---|---|---|---|---|---|---|
Maryland | 5,296,486 | +9 | 5,773,552 | +6 | 6,141,900 | +6 | 6,518,750 |
Montgomery County | 873,341 | +11 | 971,777 | +8 | 1,052,050 | +7 | 1,128,800 |
Virginia | 7,078,515 | +13 | 8,001,024 | +8 | 8,655,021 | +8 | 9,331,666 |
Arlington County | 189,453 | +10 | 207,627 | +20 | 249,298 | +10 | 274,339 |
Fairfax County | 969,749 | +12 | 1,081,726 | +7 | 1,162,504 | +7 | 1,244,025 |
Prince William County | 280,813 | +43 | 402,002 | +19 | 478,134 | +20 | 571,844 |
Alexandria city | 128,283 | +9 | 139,966 | +19 | 166,261 | +10 | 182,067 |
Fairfax city | 21,498 | +5 | 22,565 | +11 | 25,047 | +5 | 26,397 |
Falls Church city | 10,377 | +19 | 12,332 | +22 | 14,988 | +14 | 17,032 |
Total Working Age Population:
Total Households:
Total Working Age Population:
Total Households:
Total Working Age Population:
Total Households: