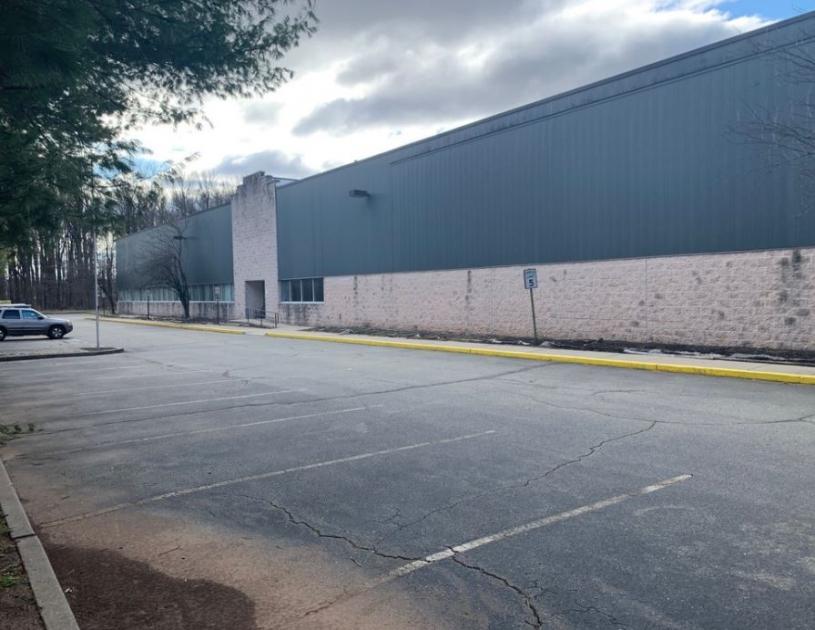
Industrial Properties
110 Pomponio Avenue South Plainfield, NJ 07080
110 Pomponio Avenue South Plainfield, NJ 07080
Details & Description
Property Highlights
- • 77 surface parking spaces
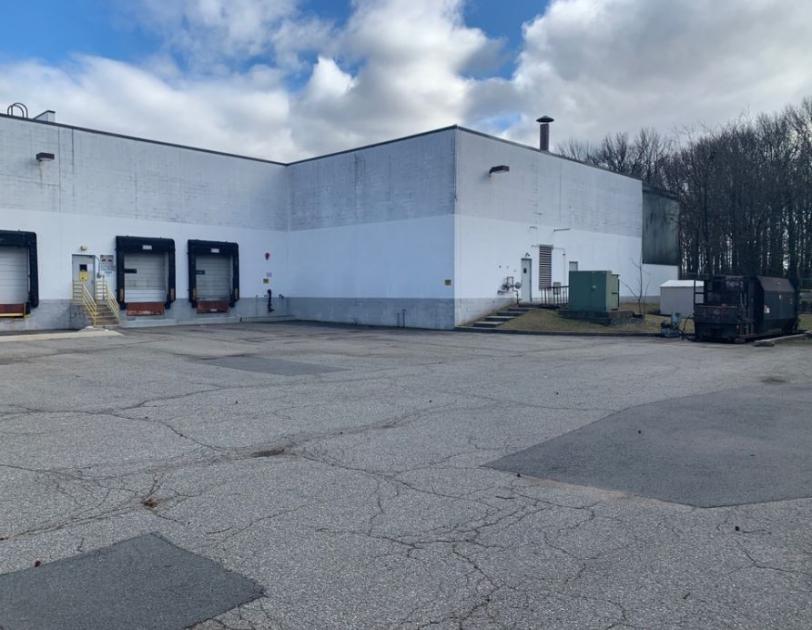
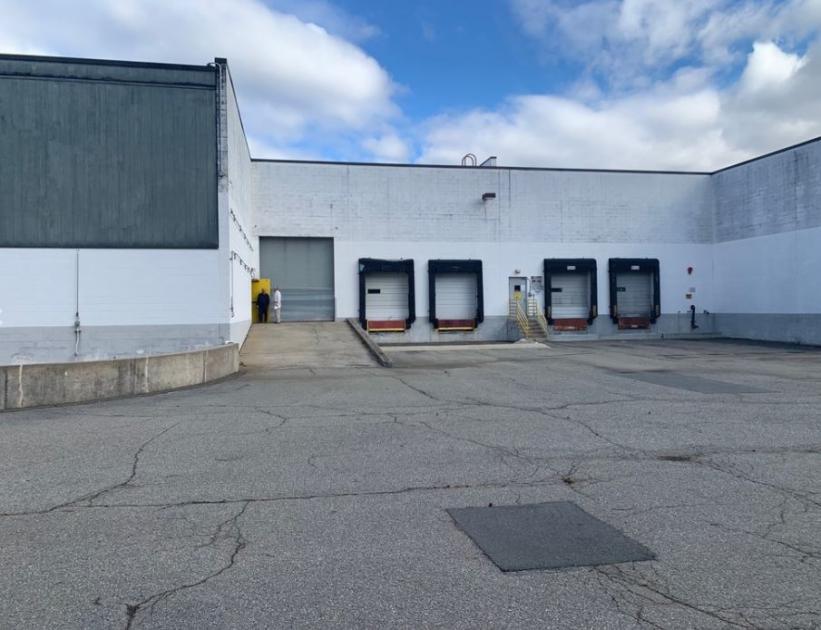
- • 4 tailboards 1 drive-in door
- • 22 ceiling height
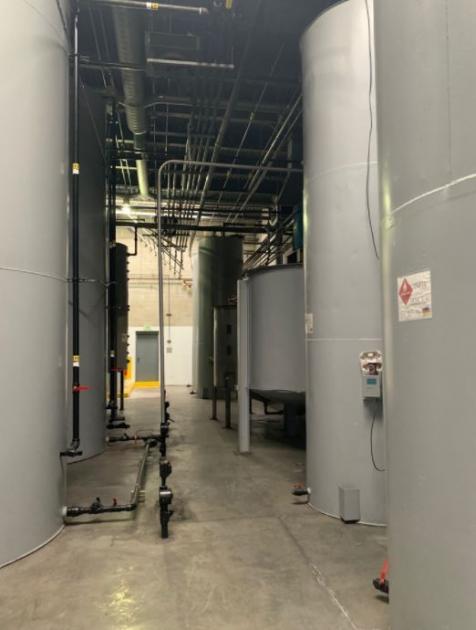
- • Property has storage tanks and mixers on site
- • Taxes, $78,974.33 2019
Additional Photos
Listing Agents

Douglas Sitar
O: 732-283-9000
M: 732-859-2144
dsitar@sitarcompany.com
O: 732-283-9000
M: 732-859-2144
dsitar@sitarcompany.com
While we strive to provide the most accurate information, all listing information, and demographic data, is provided by third-parties. As such, MyEListing will not be responsible for the accuracy of the information. It is strongly recommended that you verify all information with the listing agent, and any relevant agencies, prior to making any decisions.


