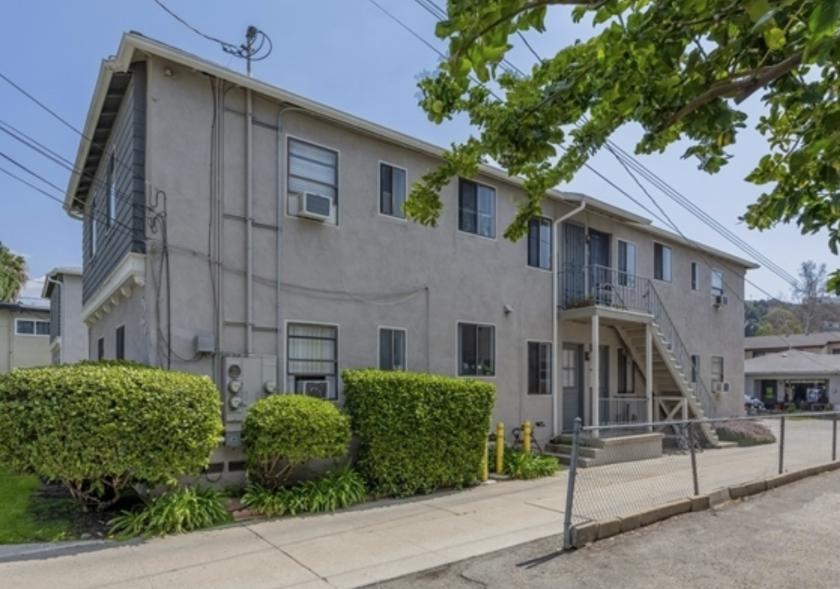
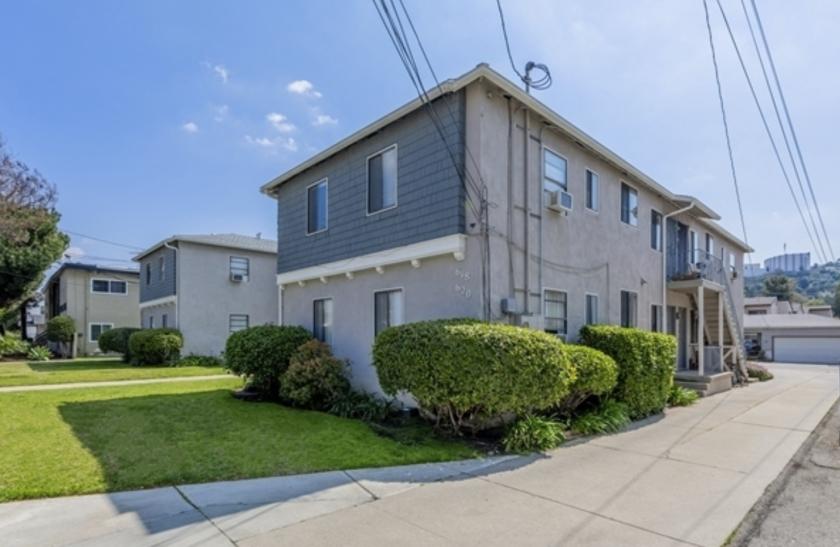
1-Mile | 3-Miles | 5-Miles | ||
---|---|---|---|---|
Total Population | 54,045 | 260,042 | 673,055 | |
Population Median Age | 41 | 40 | 40 | |
Population by Age | 0-9 Yrs | 5372 (9%) | 26139 (10%) | 66356 (9%) |
10-19 Yrs | 4687 (8%) | 23536 (9%) | 61508 (9%) | |
20-29 Yrs | 8580 (15%) | 37535 (14%) | 107078 (15%) | |
30-39 Yrs | 8551 (15%) | 45272 (17%) | 120206 (17%) | |
40-49 Yrs | 6744 (12%) | 35772 (13%) | 92762 (13%) | |
50-59 Yrs | 7386 (13%) | 34274 (13%) | 87304 (12%) | |
60-69 Yrs | 5739 (10%) | 27841 (10%) | 70071 (10%) | |
70+ Yrs | 6984 (12%) | 29674 (11%) | 67772 (10%) | |
Median HH Income | $46,917 | $69,679 | $63,276 | |
Total Household Income | < 24K | 6077 (30%) | 19763 (20%) | 55387 (21%) |
25-49K | 4245 (21%) | 16839 (17%) | 49239 (19%) | |
50-74K | 3153 (15%) | 14844 (15%) | 40156 (15%) | |
75-99K | 2134 (10%) | 11578 (11%) | 29020 (11%) | |
100-199K | 3414 (17%) | 23759 (24%) | 54848 (21%) | |
200K+ | 940 (4%) | 9935 (10%) | 24656 (9%) | |
Highest Education Level | No Diploma | 7579 | 28048 | 92922 |
Diploma or GED | 9519 | 37299 | 93214 | |
Some College | 5688 | 30788 | 82360 | |
Assoc. Degree | 4526 | 17976 | 36919 | |
Bachelors Degree | 8851 | 53523 | 132487 | |
Higher Degree | 4368 | 27588 | 65881 | |
Total Housing Units | 21,105 | 103,036 | 273,596 | |
--Owner-Occupied | 3,090 | 32,844 | 76,565 | |
--Renter-Occupied | 16,872 | 63,874 | 176,741 | |
Owner-Occupied Values | < 100K | 59 | 494 | 1188 |
100-199K | 25 | 259 | 805 | |
200-299K | 108 | 677 | 1695 | |
300-399K | 287 | 1851 | 3923 | |
400-499K | 553 | 2991 | 6385 | |
500K+ | 2057 | 26572 | 62570 | |
Total Working Age Population | 45,767 | 220,158 | 569,947 | |
In Work Force | 27,861 | 145,004 | 383,731 | |
Not In Work Force | 17,906 | 75,153 | 186,216 | |
Workforce Employed | 25,490 | 135,182 | 357,954 | |
Workforce Unemployed | 2,251 | 9,611 | 25,469 | |
Civlian Workforce | 27,741 | 144,794 | 383,423 | |
Military Workforce | 120 | 211 | 308 | |
Total Households | 19,962 | 96,719 | 253,306 | |
Family Households | 12,915 | 60,234 | 146,287 | |
Non-Family Households | 7,047 | 36,485 | 107,019 | |
Married Couple | 8,980 | 42,351 | 99,296 | |
Other Family | 3,935 | 17,883 | 46,991 | |
Married w/Child | 3,506 | 16,752 | 38,451 | |
Single Male w/Child | 294 | 1,691 | 4,993 | |
Single Female w/Child | 750 | 4,065 | 11,706 |
Population Change Last Two Decades - Plus Projection
2000 | % | 2010 | % | 2020 | % | 2030 | |
---|---|---|---|---|---|---|---|
California | 33,871,648 | +10 | 37,253,956 | +9 | 40,467,295 | +8 | 43,631,295 |
Los Angeles County | 9,519,338 | +3 | 9,818,605 | +6 | 10,369,367 | +4 | 10,759,850 |
Total Working Age Population:
Total Households:
Total Working Age Population:
Total Households:
Total Working Age Population:
Total Households: