Retail Space
2615 Linglestown Road Harrisburg, PA 17110
2615 Linglestown Road Harrisburg, PA 17110

Details & Description
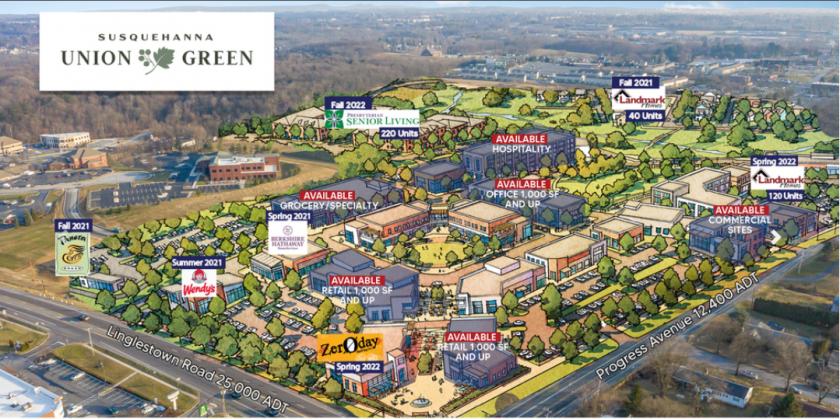
Property Highlights
- • Building ready pads for sale
- • Build-to-suit leases and turn-key sales available
- • Footprints from 2,700 - 26,800 SF 0.5-4 Ac
- • A variety of parcel locations available
- • Zoning permits a broad array of commercial uses
Listing Agents

Drew Bobincheck
O: 717-731-1990
M: 717-877-4233
dbobincheck@landmarkcr.com
O: 717-731-1990
M: 717-877-4233
dbobincheck@landmarkcr.com

Nick Sallack
O: 717-731-1990
M: 717-829-4011
nsallack@landmarkcr.com
O: 717-731-1990
M: 717-829-4011
nsallack@landmarkcr.com

Justin Shoemaker
O: 717-731-1990
justin@landmarkcr.com
O: 717-731-1990
justin@landmarkcr.com
While we strive to provide the most accurate information, all listing information, and demographic data, is provided by third-parties. As such, MyEListing will not be responsible for the accuracy of the information. It is strongly recommended that you verify all information with the listing agent, and any relevant agencies, prior to making any decisions.