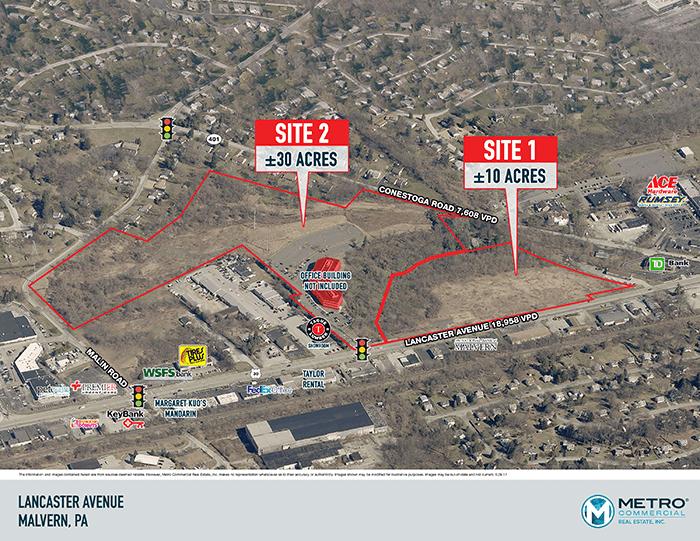
Commercial Land
Lancaster Ave and Route 401 Malvern, PA 19355
Lancaster Ave and Route 401 Malvern, PA 19355
Details & Description
Property Highlights
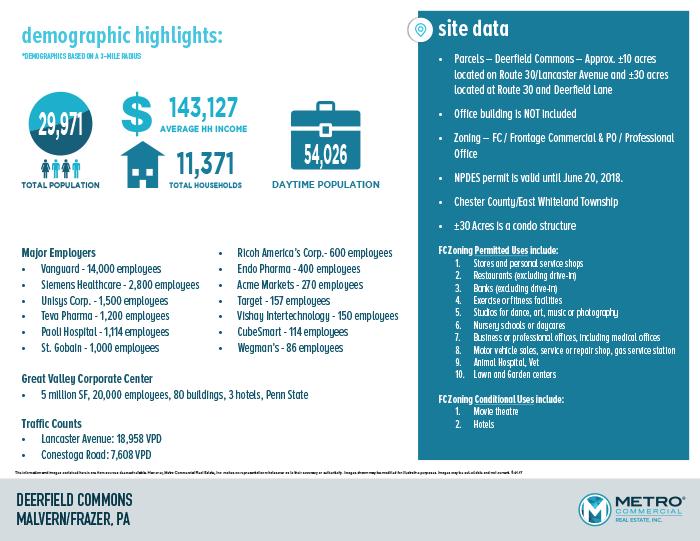
• Permitted uses include Class A office, Medical Office, Retail, Car DealershipsRepair, and More
• Development opportunity in one of the fastest growing markets in Chester County
Additional Photos


Listing Agents

Joe Dougherty
O: 610-260-2670
M: 610-580-7663
jdougherty@metrocommercial.com
O: 610-260-2670
M: 610-580-7663
jdougherty@metrocommercial.com
While we strive to provide the most accurate information, all listing information, and demographic data, is provided by third-parties. As such, MyEListing will not be responsible for the accuracy of the information. It is strongly recommended that you verify all information with the listing agent, and any relevant agencies, prior to making any decisions.


