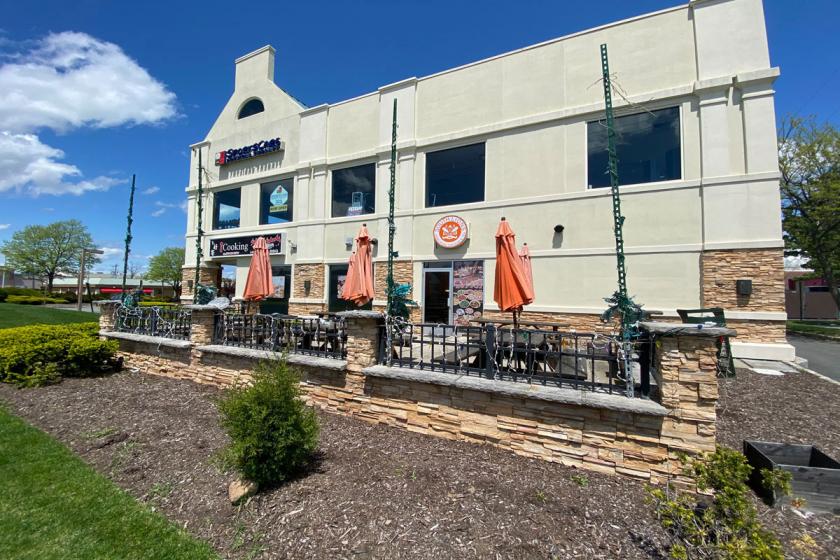
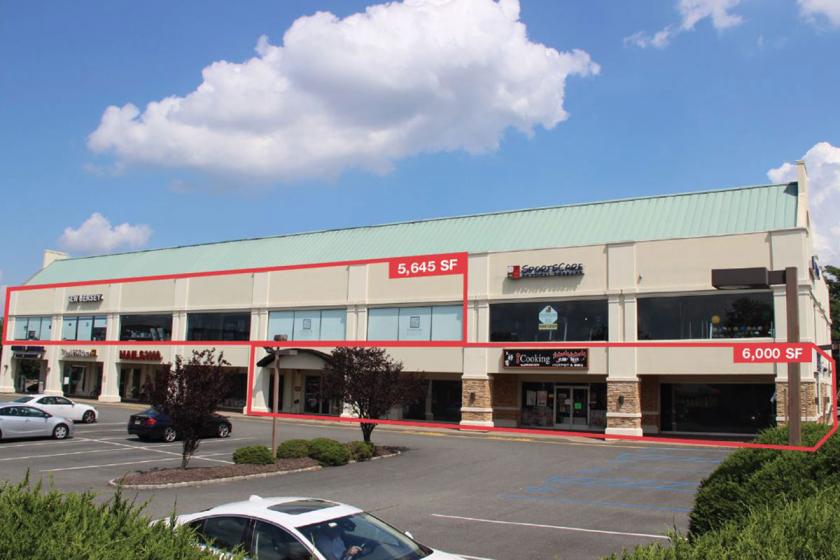
1-Mile | 3-Miles | 5-Miles | ||
---|---|---|---|---|
Total Population | 3,450 | 35,575 | 152,413 | |
Population Median Age | 42 | 43 | 41 | |
Population by Age | 0-9 Yrs | 357 (10%) | 3697 (10%) | 16924 (11%) |
10-19 Yrs | 369 (10%) | 4272 (12%) | 18564 (12%) | |
20-29 Yrs | 455 (13%) | 4265 (11%) | 17580 (11%) | |
30-39 Yrs | 338 (9%) | 3200 (8%) | 17160 (11%) | |
40-49 Yrs | 497 (14%) | 4896 (13%) | 21823 (14%) | |
50-59 Yrs | 514 (14%) | 5554 (15%) | 22651 (14%) | |
60-69 Yrs | 412 (11%) | 4296 (12%) | 17586 (11%) | |
70+ Yrs | 506 (14%) | 5394 (15%) | 20126 (13%) | |
Median HH Income | $128,835 | $138,073 | $127,455 | |
Total Household Income | < 24K | 93 (7%) | 1011 (8%) | 4553 (8%) |
25-49K | 107 (8%) | 1122 (8%) | 5283 (9%) | |
50-74K | 200 (16%) | 1263 (10%) | 5894 (10%) | |
75-99K | 118 (9%) | 1094 (8%) | 5836 (10%) | |
100-199K | 410 (32%) | 4364 (34%) | 18275 (32%) | |
200K+ | 318 (25%) | 3774 (29%) | 15728 (28%) | |
Highest Education Level | No Diploma | 219 | 1223 | 5365 |
Diploma or GED | 510 | 4837 | 17959 | |
Some College | 376 | 3026 | 11635 | |
Assoc. Degree | 87 | 1231 | 5453 | |
Bachelors Degree | 778 | 8224 | 36448 | |
Higher Degree | 481 | 6197 | 30225 | |
Total Housing Units | 1,295 | 13,041 | 58,215 | |
--Owner-Occupied | 1,104 | 10,595 | 40,016 | |
--Renter-Occupied | 142 | 2,033 | 15,553 | |
Owner-Occupied Values | < 100K | 27 | 94 | 399 |
100-199K | 24 | 146 | 560 | |
200-299K | 30 | 182 | 1588 | |
300-399K | 184 | 1071 | 5141 | |
400-499K | 143 | 1951 | 7978 | |
500K+ | 695 | 7150 | 24349 | |
Total Working Age Population | 2,860 | 29,562 | 124,351 | |
In Work Force | 1,995 | 19,105 | 82,919 | |
Not In Work Force | 865 | 10,457 | 41,432 | |
Workforce Employed | 1,886 | 18,357 | 79,586 | |
Workforce Unemployed | 109 | 723 | 3,308 | |
Civlian Workforce | 1,994 | 19,080 | 82,894 | |
Military Workforce | 1 | 25 | 25 | |
Total Households | 1,245 | 12,628 | 55,570 | |
Family Households | 947 | 9,399 | 40,127 | |
Non-Family Households | 298 | 3,229 | 15,443 | |
Married Couple | 821 | 8,071 | 34,129 | |
Other Family | 126 | 1,328 | 5,998 | |
Married w/Child | 306 | 3,321 | 15,290 | |
Single Male w/Child | 12 | 131 | 798 | |
Single Female w/Child | 51 | 321 | 1,728 |
Population Change Last Two Decades - Plus Projection
2000 | % | 2010 | % | 2020 | % | 2030 | |
---|---|---|---|---|---|---|---|
New Jersey | 8,414,350 | +4 | 8,791,894 | +4 | 9,132,700 | +4 | 9,530,900 |
Essex County | 793,633 | -1 | 783,969 | +3 | 808,300 | +3 | 829,800 |
Morris County | 470,212 | +5 | 492,276 | +3 | 509,100 | +5 | 535,600 |
Passaic County | 489,049 | +2 | 501,226 | +4 | 521,700 | +3 | 536,100 |
Somerset County | 297,490 | +9 | 323,444 | +6 | 342,900 | +7 | 366,700 |
Union County | 522,541 | +3 | 536,499 | +7 | 573,000 | +6 | 605,600 |
Total Working Age Population:
Total Households:
Total Working Age Population:
Total Households:
Total Working Age Population:
Total Households: